California Elevation & Topographic Map
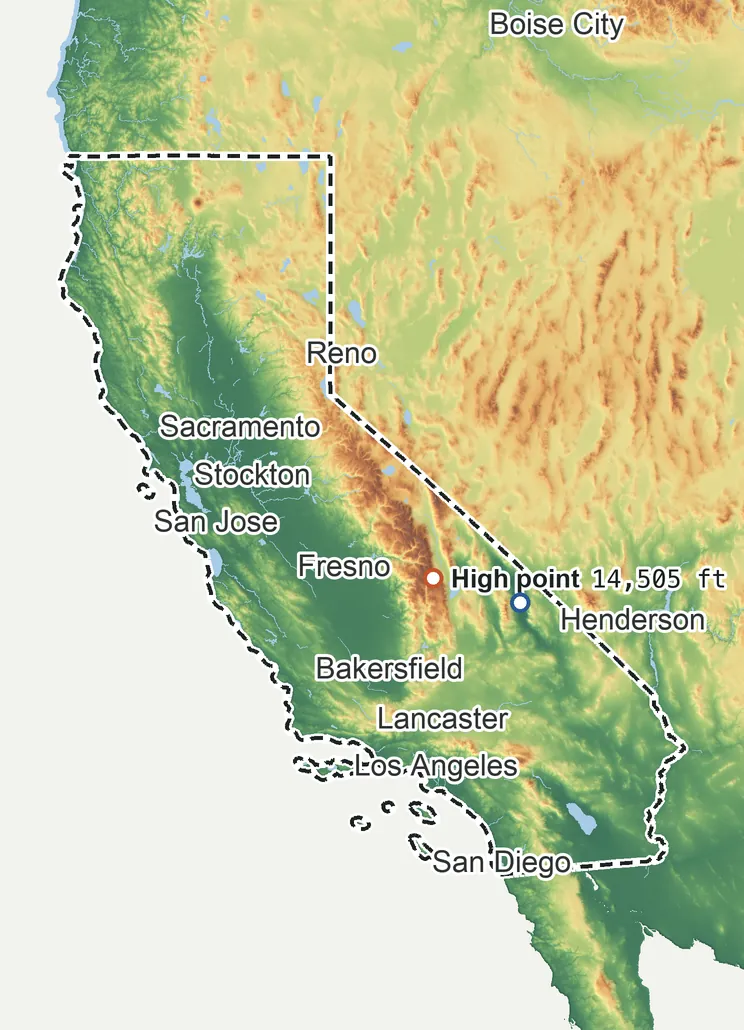
Elevation
14,500 ft 4,420 m10,810 ft 3,295 m8,960 ft 2,730 m5,260 ft 1,605 m1,570 ft 480 m−280 ft −85 m
Zoom in for contour lines
USGS 3DEP · U.S. Census Bureau
How to use this mapviews, tools and data
- Elevation
- Ground colored by height from green (lowest) to white (highest), with contour lines every 40–500 ft (USGS data).
- Satellite
- A 2016 satellite photo at 33 ft (10 m) detail; contours off.
- 3D
- Tilt and turn the terrain; hills are raised 1.5×, or set ×1 for true height.
- Click or tap anywhere
- The exact elevation of that spot in ft and m.
- Measure
- Pick two points for the climb, descent and grade along a straight line.
- State area
- Fades everything outside the official state boundary (US Census).
Elevation Data
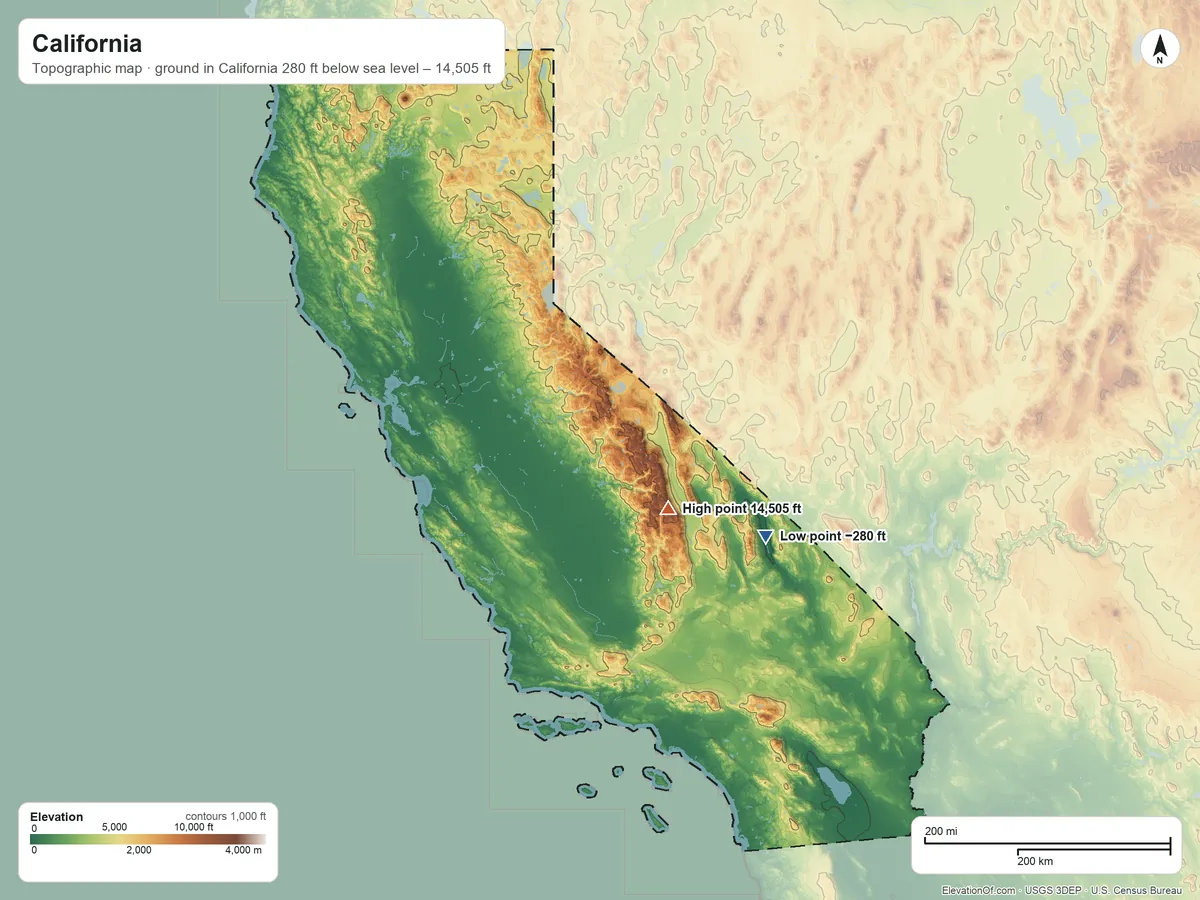
California averages about 2,820 ft (860 m) above sea level across all its land. Its ground runs from 280 ft below sea level on the southeast side to 14,505 ft on Mount Whitney.
Average elevation
2,820 ft 860 m
all land in California
Highest
14,505 ft 4,421 m
on Mount Whitney
Lowest
−280 ft −85 m
on the southeast side
California spans about 14,780 ft of height, so no single spot tells the whole story. The ruler shows where most of its land lies, and where the other numbers you'll see come from.
| Figure | Elevation |
|---|---|
| Average of all land | 2,820 ft860 m |
| Highest point In California, on Mount Whitney (NGS survey height) | 14,505 ft4,421 m |
| Lowest point In California, on the southeast side | −280 ft−85 m |
Elevation profile, south to north
308 mi south to north through Los Angeles.
Topographic Map
- Location
- State in the Pacific division of the West region, United States
- Population
- 39,431,263 2024 est.
- Land area
- 155,860.4 sq mi + 7,833.4 sq mi water
- Density
- 253 per sq mi
- Counties
- 57
- Time zone
- Pacific UTC−8 / −7
- Landform regions
- Pacific Border 47%, Basin and Range 31%, Cascade-sierra Mountains 20%
- Drains to
- Pacific Ocean 48%, Closed basin (does not reach the sea) 19%
⤓ Download this map
WebP, 1200 × 900. Free to use: credit “ElevationOf.com” with a link to this page.
Sources: U.S. Census Bureau, USGS
Nearby Places
Neighboring states sharing a border, by average
Rankings by average elevation
- States in the United States11th highest of 52
Peaks and hills highest inside
- Mount Whitney14,505 ft
- Mount Williamson14,350 ft
- White Mountain Peak14,252 ft
- North Palisade14,180 ft
- Mount Shasta14,130 ft
All 57 counties by average elevation
- Mono County7,800 ft
- Alpine County7,760 ft
- Sierra County5,730 ft
- Tuolumne County5,640 ft
- Lassen County5,390 ft
- Plumas County5,330 ft
- Modoc County5,000 ft
- Tulare County4,290 ft
- Siskiyou County4,260 ft
- Inyo County4,160 ft
- El Dorado County4,140 ft
- Nevada County4,080 ft
- Trinity County3,810 ft
- Placer County3,650 ft
- Mariposa County3,620 ft
- Fresno County3,320 ft
- Madera County3,070 ft
- Shasta County3,060 ft
- Amador County2,670 ft
- San Bernardino County2,660 ft
- Ventura County2,650 ft
- Calaveras County2,410 ft
- Lake County2,410 ft
- Kern County2,390 ft
- Los Angeles County2,250 ft
- Tehama County2,150 ft
- Del Norte County2,150 ft
- San Diego County1,970 ft
- San Benito County1,920 ft
- Riverside County1,860 ft
- Santa Barbara County1,800 ft
- Mendocino County1,790 ft
- Humboldt County1,730 ft
- Butte County1,560 ft
- San Luis Obispo County1,530 ft
- Monterey County1,440 ft
- Glenn County1,330 ft
- Santa Clara County1,250 ft
- Yuba County1,040 ft
- Napa County960 ft
- Santa Cruz County880 ft
- Alameda County840 ft
- Colusa County800 ft
- Sonoma County730 ft
- Orange County700 ft
- San Mateo County610 ft
- Stanislaus County520 ft
- Contra Costa County500 ft
- Marin County430 ft
- Imperial County410 ft
- Merced County390 ft
- Kings County380 ft
- Yolo County360 ft
- Solano County180 ft
- San Joaquin County170 ft
- Sacramento County98 ft
- Sutter County80 ft
All 104 tribal lands by average elevation
- Bridgeport Reservation6,410 ft
- Benton Paiute Reservation5,720 ft
- Woodfords Community5,700 ft
- Fort Bidwell Reservation5,690 ft
- Ewiiaapaayp Reservation5,360 ft
- Santa Rosa Reservation5,130 ft
- Los Coyotes Reservation4,930 ft
- Ramona Village4,760 ft
- Cedarville Rancheria4,720 ft
- Likely Rancheria4,680 ft
- XL Ranch Rancheria4,650 ft
- Susanville Indian Rancheria4,530 ft
- Alturas Indian Rancheria4,370 ft
- Manzanita Reservation4,330 ft
- Bishop Reservation4,230 ft
- Lookout Rancheria4,160 ft
- Fort Independence Reservation4,020 ft
- Big Pine Reservation3,990 ft
- Pauma and Yuima Reservation3,950 ft
- La Posta Indian Reservation3,930 ft
- Tule River Reservation3,890 ft
- Santa Ysabel Reservation3,870 ft
- Cahuilla Reservation3,870 ft
- Campo Indian Reservation3,730 ft
- Lone Pine Reservation3,710 ft
- Inaja and Cosmit Reservation3,660 ft
- Greenville Rancheria3,620 ft
- Morongo Reservation3,110 ft
- Pit River Trust Land3,050 ft
- Tuolumne Rancheria2,800 ft
- Quartz Valley Reservation2,790 ft
- Mesa Grande Reservation2,760 ft
- La Jolla Reservation2,670 ft
- Big Sandy Rancheria2,550 ft
- Viejas Reservation2,450 ft
- Montgomery Creek Rancheria2,410 ft
- Round Valley Reservation2,130 ft
- Hoopa Valley Reservation2,040 ft
- Picayune Rancheria2,010 ft
- Soboba Reservation2,000 ft
- Sherwood Valley Rancheria1,990 ft
- Agua Caliente Indian Reservation1,920 ft
- San Manuel Reservation1,910 ft
- Roaring Creek Rancheria1,890 ft
- Hopland Rancheria1,880 ft
- Capitan Grande Reservation1,860 ft
- San Pasqual Reservation1,760 ft
- Big Bend Rancheria1,740 ft
- Laytonville Rancheria1,710 ft
- Jackson Rancheria1,690 ft
- Upper Lake Rancheria1,640 ft
- Barona Reservation1,610 ft
- Karuk Reservation1,580 ft
- Pechanga Reservation1,560 ft
- Cold Springs Rancheria1,550 ft
- Chicken Ranch Rancheria1,470 ft
- Robinson Rancheria1,470 ft
- Shingle Springs Rancheria1,420 ft
- Sulphur Bank Rancheria1,340 ft
- Big Valley Rancheria1,330 ft
- Rincon Reservation1,290 ft
- Pala Reservation1,230 ft
- Redwood Valley Rancheria1,230 ft
- Middletown Rancheria1,230 ft
- North Fork Rancheria1,180 ft
- Cortina Indian Rancheria1,130 ft
- Jamul Indian Village940 ft
- Ione Band of Miwok TDSA910 ft
- Table Mountain Rancheria870 ft
- Guidiville Rancheria820 ft
- Enterprise Rancheria790 ft
- Stewarts Point Rancheria780 ft
- Yurok Reservation770 ft
- Coyote Valley Reservation720 ft
- Berry Creek Rancheria710 ft
- Chemehuevi Reservation700 ft
- Sycuan Reservation700 ft
- Pinoleville Rancheria640 ft
- Grindstone Indian Rancheria630 ft
- Santa Ynez Reservation530 ft
- Redding Rancheria460 ft
- Dry Creek Rancheria430 ft
- Twenty-Nine Palms Reservation410 ft
- Rumsey Indian Rancheria350 ft
- Paskenta Rancheria300 ft
- Mooretown Rancheria300 ft
- Fort Yuma Indian Reservation270 ft
- Rohnerville (Rancheria) Trust Land250 ft
- Auburn Rancheria240 ft
- Mechoopda TDSA230 ft
- Santa Rosa Rancheria200 ft
- Trinidad Rancheria190 ft
- Manchester-Point Arena Rancheria140 ft
- Table Bluff Reservation110 ft
- Lytton Rancheria98 ft
- Smith River Rancheria95 ft
- Elk Valley Rancheria86 ft
- Blue Lake Rancheria75 ft
- Colusa Rancheria62 ft
- Resighini Rancheria32 ft
- Big Lagoon Rancheria22 ft
- Torres-Martinez Reservation−36 ft
- Augustine Reservation−82 ft
- Cabazon Reservation−89 ft
How we measure
- Average: every USGS 3DEP bare-earth cell of land inside the Census state boundary (TIGER/Line, Jan 1 2026), weighted equally, on a 13 arc-second (≈1,320 ft, 401 m) grid, coarsened from 1 arc-second so the whole area fits one run. Land means the boundary minus Census area water (on this grid, water areas of at least half a cell).
- Highest and lowest: the highest land cell, re-read at 1 arc-second around the 25 highest grid cells; it is a named summit, so its height is the peak method: the 3DEP top on a ~7 ft (2 m) window, or the NGS published height when a survey mark sits within 160 ft (50 m) of it. Lowest: the lowest land cell, re-read at 1 arc-second around the 25 lowest grid cells; coastal ground within 3 ft (1 m) of named tidal water counts as sea level.
- Nearby Places: neighboring states and rankings use each one's average elevation, on its own grid, the same figure its page shows. Peaks and hills: the highest summits inside the state with at least 980 ft (300 m) of prominence, then the highest federal (GNIS) summits inside it when there are fewer than 5; each is the 3DEP top on a ~7 ft (2 m) window, or the NGS published height when a usable survey mark sits within 160 ft (50 m) of it (shown as published).
- Counties: each one's average on its own grid (1 arc-second, coarser for the largest), the same figure its own page shows.
- Rounding: computed heights are rounded to 10 ft (5 m), or to 1 ft (1 m) under 100 ft; 3DEP is good to about a meter, not a foot. Published figures (NGS survey heights) are shown as their publisher gives them.
- Datum: North American Vertical Datum of 1988 (NAVD 88). NGS plans to replace NAVD 88 with a new datum (NAPGD2022); heights will then shift slightly.
- Sources: USGS 3DEP, GNIS, Watershed Boundary Dataset and physiographic provinces; U.S. Census Bureau (TIGER boundaries and water, 2020 blocks, 2024 population estimates, county adjacency); NOAA NGS survey heights; BTS time zones. All public domain.