Texas Elevation & Topographic Map
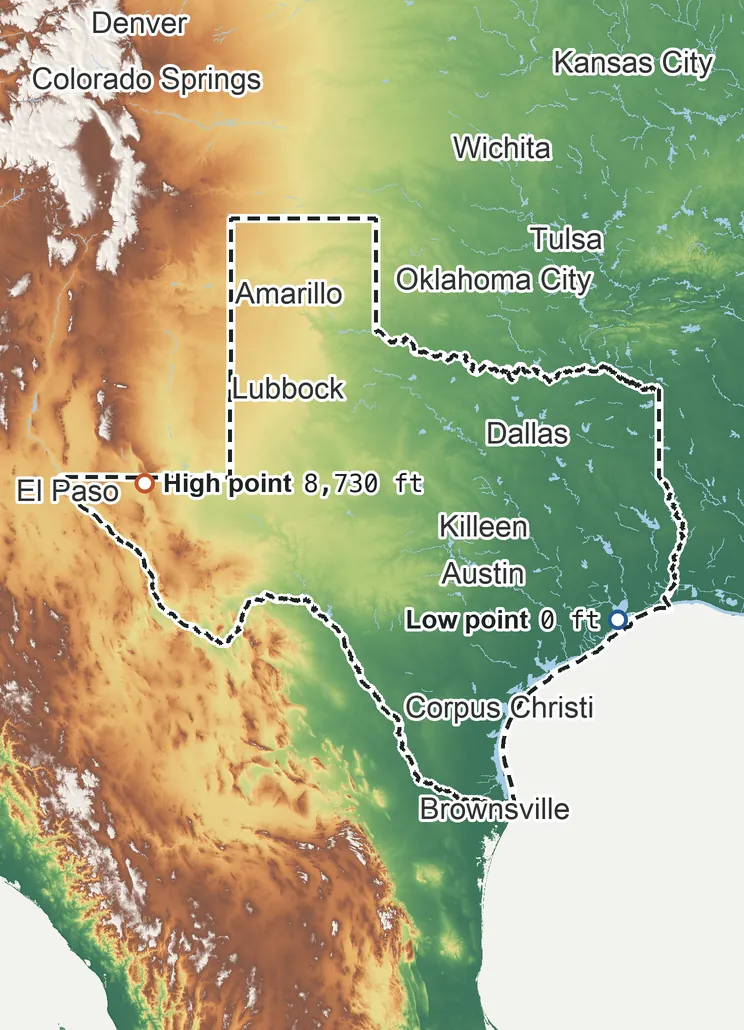
Elevation
8,730 ft 2,660 m6,550 ft 1,995 m5,460 ft 1,665 m3,270 ft 1,000 m1,090 ft 335 m0 ft 0 m
Zoom in for contour lines
USGS 3DEP · U.S. Census Bureau
How to use this mapviews, tools and data
- Elevation
- Ground colored by height from green (lowest) to white (highest), with contour lines every 40–500 ft (USGS data).
- Satellite
- A 2016 satellite photo at 33 ft (10 m) detail; contours off.
- 3D
- Tilt and turn the terrain; hills are raised 1.5×, or set ×1 for true height.
- Click or tap anywhere
- The exact elevation of that spot in ft and m.
- Measure
- Pick two points for the climb, descent and grade along a straight line.
- State area
- Fades everything outside the official state boundary (US Census).
Elevation Data
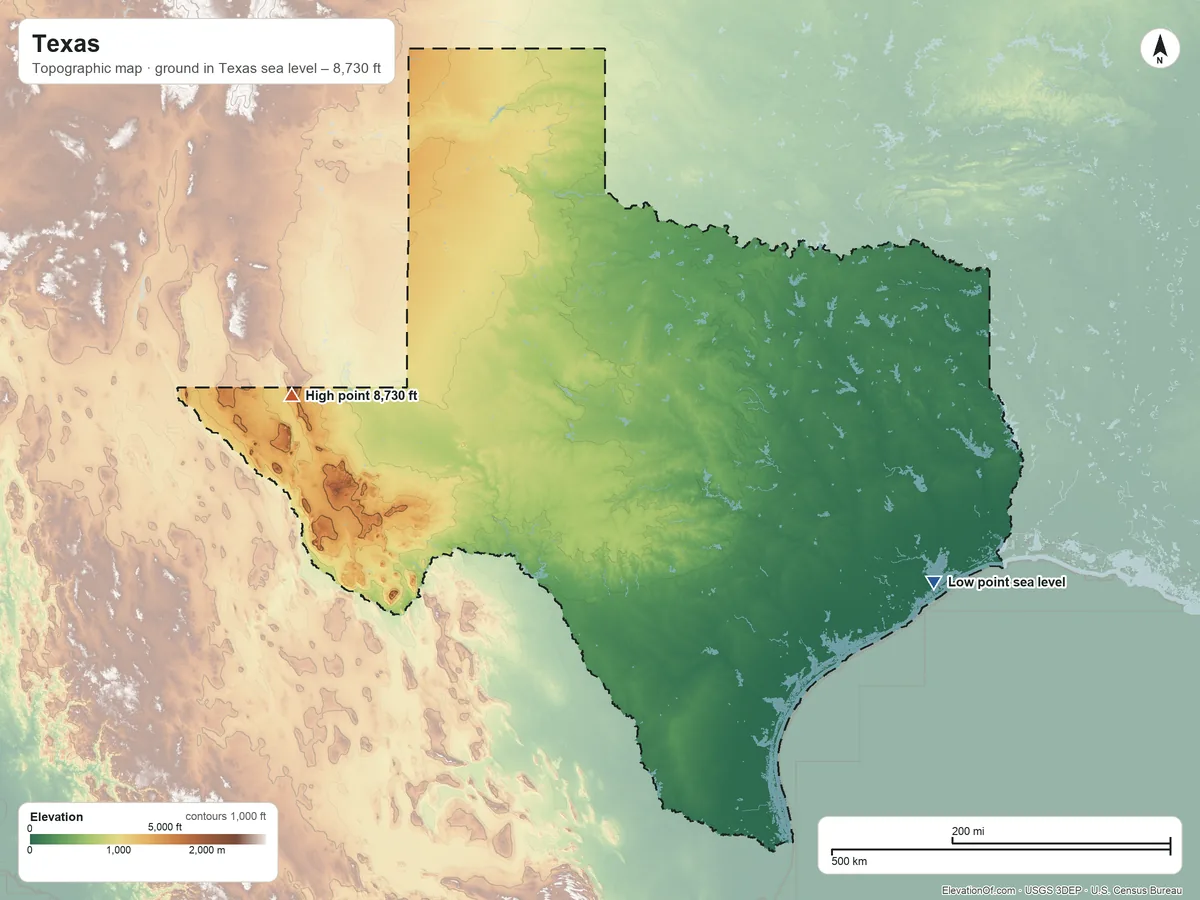
Texas averages about 1,690 ft (515 m) above sea level across all its land. Its ground runs from sea level on Galveston Bay to 8,730 ft on Guadalupe Peak.
Average elevation
1,690 ft 515 m
all land in Texas
Highest
8,730 ft 2,660 m
on Guadalupe Peak
Lowest
0 ft 0 m
at sea level on Galveston Bay
Texas spans about 8,730 ft of height, so no single spot tells the whole story. The ruler shows where most of its land lies, and where the other numbers you'll see come from.
| Figure | Elevation |
|---|---|
| Average of all land | 1,690 ft515 m |
| Highest point In Texas, on Guadalupe Peak (3DEP terrain model; no NGS survey height) | 8,730 ft2,660 m |
| Lowest point Where the land meets Galveston Bay | 0 ft0 m |
Elevation profile, west to east
640 mi west to east through Houston.
Topographic Map
- Location
- State in the West South Central division of the South region, United States
- Population
- 31,290,831 2024 est.
- Land area
- 261,259.5 sq mi + 7,339.6 sq mi water
- Density
- 120 per sq mi
- Counties
- 254
- Time zones
- Central UTC−6 / −5, Mountain UTC−7 / −6
- Landform regions
- Great Plains 41%, Coastal Plain 39%, Central Lowland 12%
- Drains to
- Gulf of America 94%
⤓ Download this map
WebP, 1200 × 900. Free to use: credit “ElevationOf.com” with a link to this page.
Sources: U.S. Census Bureau, USGS
Nearby Places
Neighboring states sharing a border, by average
- New Mexico5,780 ft
- Texas1,690 ft
- Oklahoma1,310 ft
- Arkansas530 ft
- Louisiana100 ft
Rankings by average elevation
- States in the United States17th highest of 52
Peaks and hills highest inside
- Bush Mountain8,630 ft
- Baldy Peak8,340 ft
- Chinati Peak7,720 ft
- Sawtooth Mountain7,640 ft
- Townsend Point7,560 ft
All 254 counties by average elevation
- Jeff Davis County4,910 ft
- Hudspeth County4,430 ft
- Presidio County4,250 ft
- Dallam County4,150 ft
- Culberson County4,130 ft
- Parmer County4,060 ft
- El Paso County4,060 ft
- Deaf Smith County4,050 ft
- Hartley County3,940 ft
- Bailey County3,890 ft
- Cochran County3,800 ft
- Castro County3,790 ft
- Oldham County3,720 ft
- Yoakum County3,650 ft
- Lamb County3,630 ft
- Randall County3,630 ft
- Brewster County3,600 ft
- Sherman County3,540 ft
- Moore County3,520 ft
- Hockley County3,490 ft
- Swisher County3,480 ft
- Hale County3,410 ft
- Potter County3,410 ft
- Carson County3,360 ft
- Terry County3,340 ft
- Gaines County3,320 ft
- Lubbock County3,230 ft
- Andrews County3,180 ft
- Floyd County3,150 ft
- Hansford County3,150 ft
- Armstrong County3,140 ft
- Pecos County3,130 ft
- Lynn County3,090 ft
- Hutchinson County3,070 ft
- Ector County3,030 ft
- Gray County3,020 ft
- Reeves County2,980 ft
- Dawson County2,960 ft
- Loving County2,940 ft
- Ochiltree County2,930 ft
- Crosby County2,920 ft
- Winkler County2,920 ft
- Roberts County2,830 ft
- Briscoe County2,830 ft
- Martin County2,770 ft
- Midland County2,770 ft
- Upton County2,730 ft
- Donley County2,660 ft
- Reagan County2,660 ft
- Glasscock County2,650 ft
- Ward County2,610 ft
- Lipscomb County2,590 ft
- Borden County2,560 ft
- Crane County2,560 ft
- Hemphill County2,530 ft
- Howard County2,520 ft
- Garza County2,520 ft
- Sterling County2,480 ft
- Wheeler County2,450 ft
- Crockett County2,430 ft
- Irion County2,410 ft
- Dickens County2,390 ft
- Terrell County2,380 ft
- Schleicher County2,370 ft
- Scurry County2,360 ft
- Nolan County2,350 ft
- Motley County2,340 ft
- Sutton County2,240 ft
- Mitchell County2,180 ft
- Collingsworth County2,130 ft
- Coke County2,130 ft
- Edwards County2,120 ft
- Kent County2,110 ft
- Menard County2,110 ft
- Hall County2,080 ft
- Tom Green County2,070 ft
- Real County2,050 ft
- Kimble County2,040 ft
- Kerr County2,020 ft
- Taylor County2,010 ft
- Fisher County2,000 ft
- Concho County1,870 ft
- Gillespie County1,840 ft
- Runnels County1,820 ft
- Cottle County1,810 ft
- Callahan County1,800 ft
- King County1,800 ft
- Childress County1,790 ft
- Stonewall County1,760 ft
- Coleman County1,700 ft
- Val Verde County1,700 ft
- Jones County1,690 ft
- McCulloch County1,690 ft
- Bandera County1,670 ft
- Mason County1,640 ft
- Kendall County1,560 ft
- Shackelford County1,540 ft
- Haskell County1,530 ft
- Brown County1,520 ft
- Eastland County1,520 ft
- Hardeman County1,520 ft
- Foard County1,500 ft
- Knox County1,460 ft
- Mills County1,460 ft
- San Saba County1,450 ft
- Throckmorton County1,370 ft
- Comanche County1,360 ft
- Blanco County1,340 ft
- Stephens County1,280 ft
- Baylor County1,270 ft
- Erath County1,250 ft
- Kinney County1,240 ft
- Llano County1,230 ft
- Wilbarger County1,230 ft
- Lampasas County1,230 ft
- Hamilton County1,210 ft
- Uvalde County1,180 ft
- Young County1,170 ft
- Burnet County1,160 ft
- Jack County1,090 ft
- Archer County1,070 ft
- Palo Pinto County1,050 ft
- Wichita County1,050 ft
- Comal County1,030 ft
- Parker County970 ft
- Montague County970 ft
- Hays County970 ft
- Medina County960 ft
- Clay County960 ft
- Coryell County960 ft
- Hood County890 ft
- Wise County890 ft
- Somervell County840 ft
- Cooke County840 ft
- Bosque County840 ft
- Bexar County810 ft
- Maverick County790 ft
- Johnson County790 ft
- Williamson County760 ft
- Travis County730 ft
- Grayson County720 ft
- Zavala County690 ft
- Bell County670 ft
- Tarrant County660 ft
- Denton County650 ft
- Collin County630 ft
- Hill County620 ft
- Dimmit County610 ft
- Fannin County600 ft
- Webb County590 ft
- Frio County580 ft
- McLennan County570 ft
- Guadalupe County560 ft
- Hunt County550 ft
- Ellis County540 ft
- Jim Hogg County540 ft
- Rockwall County530 ft
- Dallas County520 ft
- Caldwell County500 ft
- Lamar County500 ft
- Duval County490 ft
- Limestone County490 ft
- Hopkins County480 ft
- Van Zandt County470 ft
- Bastrop County470 ft
- Delta County460 ft
- Wilson County450 ft
- Smith County450 ft
- Rains County450 ft
- Zapata County440 ft
- Kaufman County430 ft
- Falls County430 ft
- Atascosa County430 ft
- Wood County430 ft
- La Salle County420 ft
- Henderson County410 ft
- Lee County410 ft
- Franklin County410 ft
- Navarro County410 ft
- Milam County410 ft
- Rusk County410 ft
- Red River County400 ft
- Cherokee County390 ft
- Freestone County390 ft
- Anderson County380 ft
- Robertson County380 ft
- Upshur County370 ft
- Fayette County370 ft
- Camp County360 ft
- Karnes County360 ft
- Titus County350 ft
- Starr County350 ft
- Leon County350 ft
- Morris County340 ft
- Gonzales County340 ft
- Gregg County340 ft
- Nacogdoches County330 ft
- McMullen County320 ft
- Bowie County320 ft
- Burleson County320 ft
- Shelby County310 ft
- Houston County310 ft
- Cass County310 ft
- Washington County300 ft
- Harrison County300 ft
- Grimes County300 ft
- San Augustine County290 ft
- Walker County280 ft
- Panola County280 ft
- Brazos County280 ft
- DeWitt County280 ft
- Madison County270 ft
- Sabine County260 ft
- Marion County260 ft
- Live Oak County250 ft
- Lavaca County250 ft
- Trinity County250 ft
- Polk County240 ft
- Bee County240 ft
- Colorado County240 ft
- Angelina County230 ft
- Austin County230 ft
- San Jacinto County230 ft
- Jim Wells County210 ft
- Waller County200 ft
- Tyler County200 ft
- Montgomery County200 ft
- Goliad County190 ft
- Brooks County180 ft
- Newton County170 ft
- Jasper County160 ft
- Hidalgo County120 ft
- Wharton County100 ft
- Victoria County90 ft
- Fort Bend County86 ft
- Harris County85 ft
- Liberty County72 ft
- Hardin County71 ft
- San Patricio County62 ft
- Jackson County60 ft
- Nueces County55 ft
- Kleberg County48 ft
- Refugio County44 ft
- Matagorda County28 ft
- Brazoria County28 ft
- Cameron County27 ft
- Kenedy County26 ft
- Willacy County25 ft
- Chambers County15 ft
- Calhoun County15 ft
- Jefferson County14 ft
- Orange County14 ft
- Galveston County12 ft
- Aransas County10 ft
All 3 tribal lands by average elevation
- Ysleta del Sur Pueblo4,630 ft
- Kickapoo (TX) Reservation730 ft
- Alabama-Coushatta Reservation280 ft
How we measure
- Average: every USGS 3DEP bare-earth cell of land inside the Census state boundary (TIGER/Line, Jan 1 2026), weighted equally, on a 16 arc-second (≈1,620 ft, 494 m) grid, coarsened from 1 arc-second so the whole area fits one run. Land means the boundary minus Census area water (on this grid, water areas of at least half a cell).
- Highest and lowest: the highest land cell, re-read at 1 arc-second around the 25 highest grid cells; it is a named summit, so its height is the peak method: the 3DEP top on a ~7 ft (2 m) window, or the NGS published height when a survey mark sits within 160 ft (50 m) of it. Lowest: the lowest land cell, re-read at 1 arc-second around the 25 lowest grid cells; coastal ground within 3 ft (1 m) of named tidal water counts as sea level.
- Pits: the lowest point is the lowest ground outside closed hollows (quarry floors, mine pits, terrain-model artifacts): any hollow under 0.4 sq mi (1 km²), and any hollow under 2 sq mi (5 km²) whose floor is more than 100 ft (30 m) below its rim; and outside patches below sea level of under 0.4 sq mi (1 km²). The single lowest 3DEP cell, −34 ft at 29.0726° N, 95.3621° W, is in such a hollow or patch and is not counted; this coastal land's lowest point is sea level on the coast.
- Nearby Places: neighboring states and rankings use each one's average elevation, on its own grid, the same figure its page shows. Peaks and hills: the highest summits inside the state with at least 980 ft (300 m) of prominence, then the highest federal (GNIS) summits inside it when there are fewer than 5; each is the 3DEP top on a ~7 ft (2 m) window, or the NGS published height when a usable survey mark sits within 160 ft (50 m) of it (shown as published).
- Counties: each one's average on its own grid (1 arc-second, coarser for the largest), the same figure its own page shows.
- Rounding: computed heights are rounded to 10 ft (5 m), or to 1 ft (1 m) under 100 ft; 3DEP is good to about a meter, not a foot. Published figures (NGS survey heights) are shown as their publisher gives them.
- Datum: North American Vertical Datum of 1988 (NAVD 88). NGS plans to replace NAVD 88 with a new datum (NAPGD2022); heights will then shift slightly.
- Sources: USGS 3DEP, GNIS, Watershed Boundary Dataset and physiographic provinces; U.S. Census Bureau (TIGER boundaries and water, 2020 blocks, 2024 population estimates, county adjacency); NOAA NGS survey heights; BTS time zones. All public domain.