Kentucky Elevation & Topographic Map
Elevation
4,140 ft 1,260 m3,170 ft 965 m2,690 ft 820 m1,720 ft 525 m750 ft 230 m270 ft 80 m
Zoom in for contour lines
USGS 3DEP · U.S. Census Bureau
How to use this mapviews, tools and data
- Elevation
- Ground colored by height from green (lowest) to white (highest), with contour lines every 40–500 ft (USGS data).
- Satellite
- A 2016 satellite photo at 33 ft (10 m) detail; contours off.
- 3D
- Tilt and turn the terrain; hills are raised 1.5×, or set ×1 for true height.
- Click or tap anywhere
- The exact elevation of that spot in ft and m.
- Measure
- Pick two points for the climb, descent and grade along a straight line.
- State area
- Fades everything outside the official state boundary (US Census).
Elevation Data
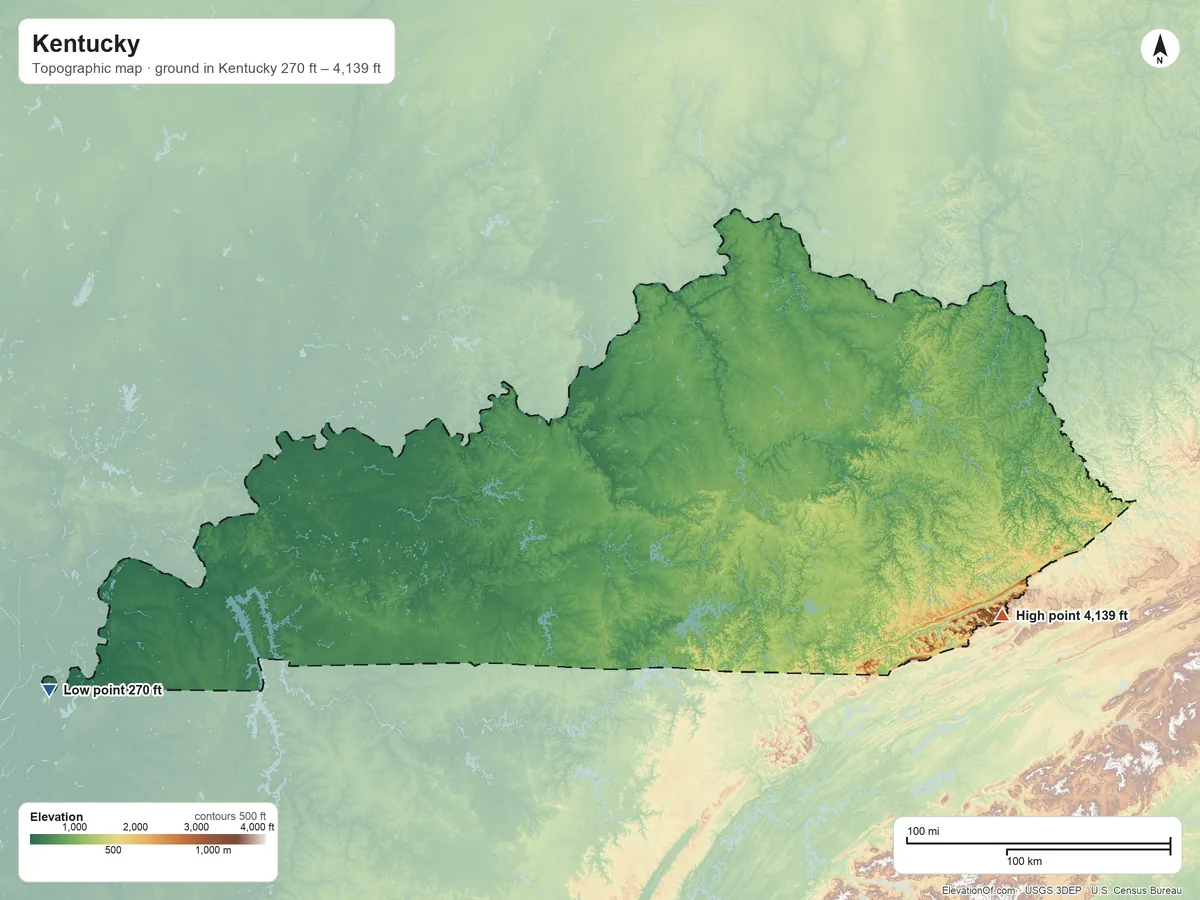
Kentucky averages about 830 ft (255 m) above sea level across all its land. Its ground runs from 270 ft on the west side to 4,139 ft on Black Mountain.
Average elevation
830 ft 255 m
all land in Kentucky
Highest
4,139 ft 1,262 m
on Black Mountain
Lowest
270 ft 80 m
on the west side
Kentucky spans about 3,870 ft of height, so no single spot tells the whole story. The ruler shows where most of its land lies, and where the other numbers you'll see come from.
| Figure | Elevation |
|---|---|
| Average of all land | 830 ft255 m |
| Highest point In Kentucky, on Black Mountain (NGS survey height) | 4,139 ft1,262 m |
| Lowest point In Kentucky, on the west side | 270 ft80 m |
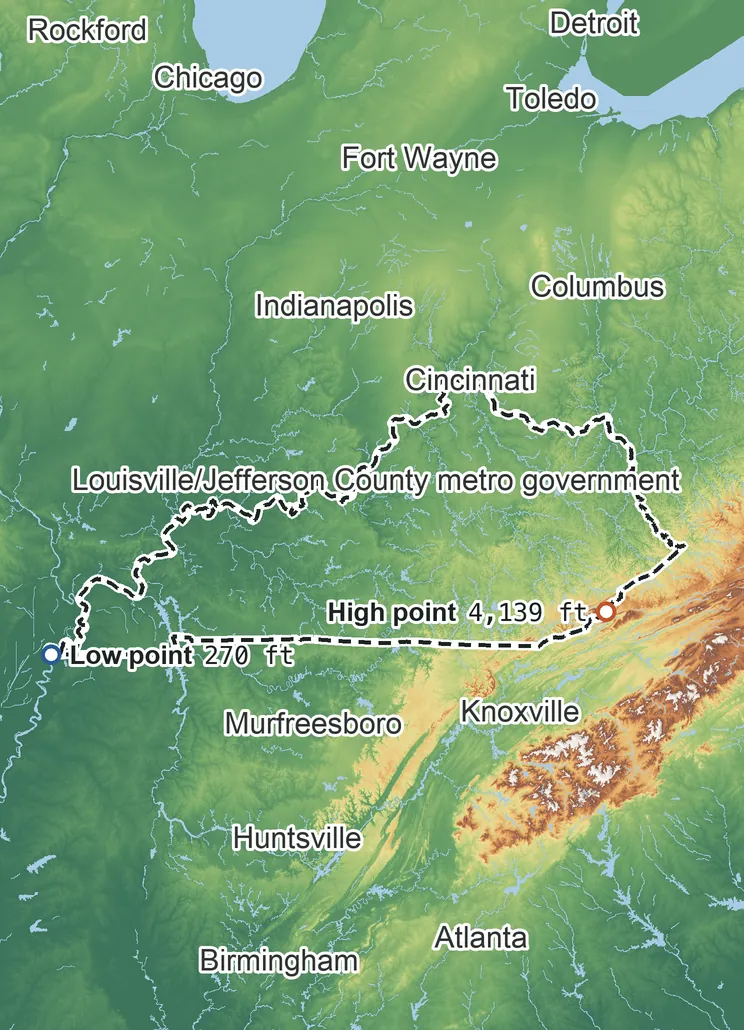
Elevation profile, west to east
203 mi west to east through Louisville/Jefferson County metro government.
Topographic Map
- Location
- State in the East South Central division of the South region, United States
- Population
- 4,588,372 2024 est.
- Land area
- 39,485.8 sq mi + 920.1 sq mi water
- Density
- 116 per sq mi
- Counties
- 119
- Time zones
- Eastern UTC−5 / −4, Central UTC−6 / −5
- Landform regions
- Interior Low Plateaus 65%, Appalachian Plateaus 29%
- Drains to
- Gulf of America
⤓ Download this map
WebP, 1200 × 900. Free to use: credit “ElevationOf.com” with a link to this page.
Sources: U.S. Census Bureau, USGS
Nearby Places
Neighboring states sharing a border, by average
Rankings by average elevation
- States in the United States33rd highest of 52
Peaks and hills highest inside
- Black Mountain4,139 ft
- Potato Hill, Harlan County3,690 ft
- White Rocks3,380 ft
- Brush Mountain, Bell County3,360 ft
- Kitts Knob3,350 ft
All 119 counties by average elevation
- Harlan County2,140 ft
- Letcher County1,740 ft
- Bell County1,690 ft
- Leslie County1,480 ft
- Knott County1,360 ft
- Perry County1,320 ft
- Pike County1,320 ft
- Knox County1,260 ft
- Jackson County1,220 ft
- Whitley County1,210 ft
- Clay County1,200 ft
- McCreary County1,190 ft
- Rockcastle County1,160 ft
- Laurel County1,160 ft
- Magoffin County1,090 ft
- Wayne County1,080 ft
- Breathitt County1,070 ft
- Wolfe County1,070 ft
- Menifee County1,070 ft
- Lincoln County1,070 ft
- Floyd County1,060 ft
- Owsley County1,050 ft
- Casey County1,020 ft
- Pulaski County1,020 ft
- Rowan County1,000 ft
- Clinton County1,000 ft
- Morgan County990 ft
- Martin County970 ft
- Boyle County970 ft
- Lee County960 ft
- Garrard County930 ft
- Montgomery County930 ft
- Elliott County930 ft
- Russell County930 ft
- Powell County920 ft
- Estill County910 ft
- Clark County900 ft
- Johnson County900 ft
- Madison County900 ft
- Jessamine County900 ft
- Lewis County890 ft
- Bourbon County890 ft
- Scott County880 ft
- Carter County870 ft
- Fleming County860 ft
- Adair County860 ft
- Bath County860 ft
- Taylor County860 ft
- Nicholas County850 ft
- Metcalfe County850 ft
- Mercer County840 ft
- Mason County840 ft
- Monroe County840 ft
- Woodford County830 ft
- Lawrence County830 ft
- Grant County820 ft
- Harrison County810 ft
- Bracken County800 ft
- Marion County790 ft
- Shelby County790 ft
- Robertson County790 ft
- Henry County780 ft
- Larue County780 ft
- Owen County780 ft
- Kenton County780 ft
- Anderson County780 ft
- Cumberland County770 ft
- Washington County770 ft
- Greenup County770 ft
- Boone County760 ft
- Trimble County760 ft
- Boyd County740 ft
- Franklin County740 ft
- Pendleton County740 ft
- Barren County740 ft
- Oldham County720 ft
- Hardin County720 ft
- Green County720 ft
- Hart County710 ft
- Allen County710 ft
- Campbell County700 ft
- Gallatin County680 ft
- Simpson County670 ft
- Carroll County670 ft
- Spencer County660 ft
- Meade County650 ft
- Nelson County650 ft
- Grayson County640 ft
- Edmonson County640 ft
- Breckinridge County630 ft
- Todd County620 ft
- Logan County600 ft
- Bullitt County580 ft
- Warren County570 ft
- Jefferson County570 ft
- Christian County570 ft
- Butler County510 ft
- Hancock County500 ft
- Calloway County500 ft
- Caldwell County500 ft
- Trigg County500 ft
- Ohio County480 ft
- Crittenden County480 ft
- Muhlenberg County480 ft
- Graves County470 ft
- Lyon County460 ft
- Hopkins County440 ft
- Livingston County430 ft
- Webster County430 ft
- Daviess County420 ft
- Marshall County420 ft
- McLean County410 ft
- Henderson County400 ft
- Union County400 ft
- Carlisle County390 ft
- McCracken County380 ft
- Ballard County380 ft
- Hickman County370 ft
- Fulton County340 ft
How we measure
- Average: every USGS 3DEP bare-earth cell of land inside the Census state boundary (TIGER/Line, Jan 1 2026), weighted equally, on a 6 arc-second (≈610 ft, 185 m) grid, coarsened from 1 arc-second so the whole area fits one run. Land means the boundary minus Census area water (on this grid, water areas of at least half a cell).
- Highest and lowest: the highest land cell, re-read at 1 arc-second around the 25 highest grid cells; it is a named summit, so its height is the peak method: the 3DEP top on a ~7 ft (2 m) window, or the NGS published height when a survey mark sits within 160 ft (50 m) of it. Lowest: the lowest land cell, re-read at 1 arc-second around the 25 lowest grid cells; coastal ground within 3 ft (1 m) of named tidal water counts as sea level.
- Nearby Places: neighboring states and rankings use each one's average elevation, on its own grid, the same figure its page shows. Peaks and hills: the highest summits inside the state with at least 980 ft (300 m) of prominence, then the highest federal (GNIS) summits inside it when there are fewer than 5; each is the 3DEP top on a ~7 ft (2 m) window, or the NGS published height when a usable survey mark sits within 160 ft (50 m) of it (shown as published).
- Counties: each one's average on its own grid (1 arc-second, coarser for the largest), the same figure its own page shows.
- Rounding: computed heights are rounded to 10 ft (5 m), or to 1 ft (1 m) under 100 ft; 3DEP is good to about a meter, not a foot. Published figures (NGS survey heights) are shown as their publisher gives them.
- Datum: North American Vertical Datum of 1988 (NAVD 88). NGS plans to replace NAVD 88 with a new datum (NAPGD2022); heights will then shift slightly.
- Sources: USGS 3DEP, GNIS, Watershed Boundary Dataset and physiographic provinces; U.S. Census Bureau (TIGER boundaries and water, 2020 blocks, 2024 population estimates, county adjacency); NOAA NGS survey heights; BTS time zones. All public domain.