Georgia Elevation & Topographic Map
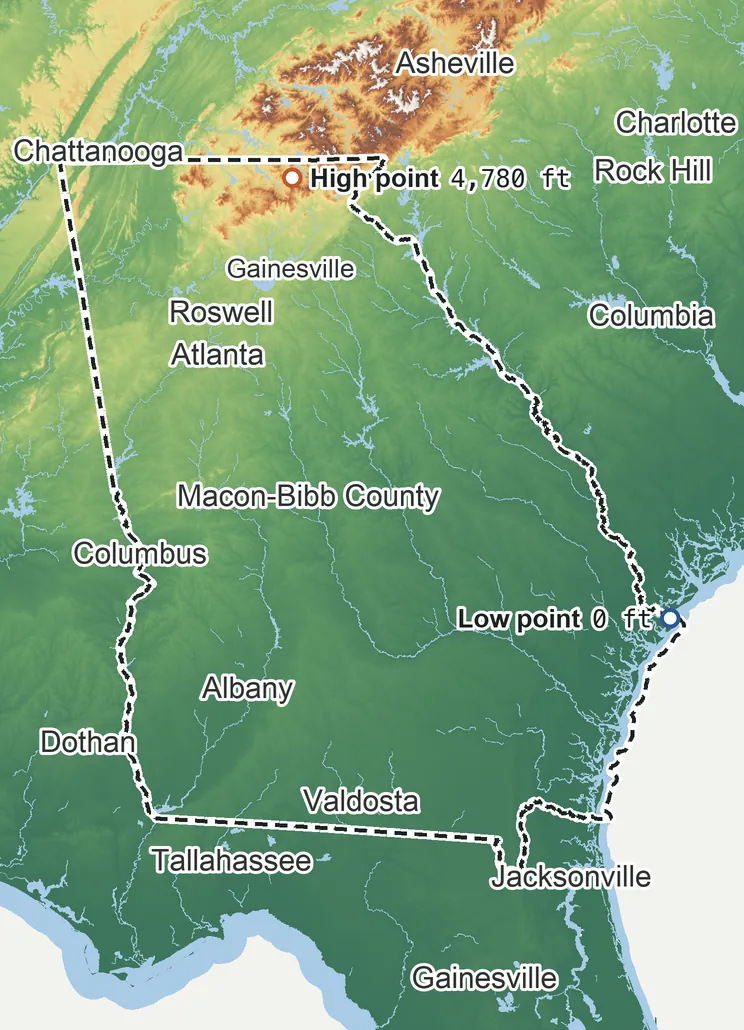
Elevation
4,780 ft 1,455 m3,580 ft 1,090 m2,990 ft 910 m1,790 ft 545 m600 ft 180 m0 ft 0 m
Zoom in for contour lines
USGS 3DEP · U.S. Census Bureau
How to use this mapviews, tools and data
- Elevation
- Ground colored by height from green (lowest) to white (highest), with contour lines every 40–500 ft (USGS data).
- Satellite
- A 2016 satellite photo at 33 ft (10 m) detail; contours off.
- 3D
- Tilt and turn the terrain; hills are raised 1.5×, or set ×1 for true height.
- Click or tap anywhere
- The exact elevation of that spot in ft and m.
- Measure
- Pick two points for the climb, descent and grade along a straight line.
- State area
- Fades everything outside the official state boundary (US Census).
Elevation Data
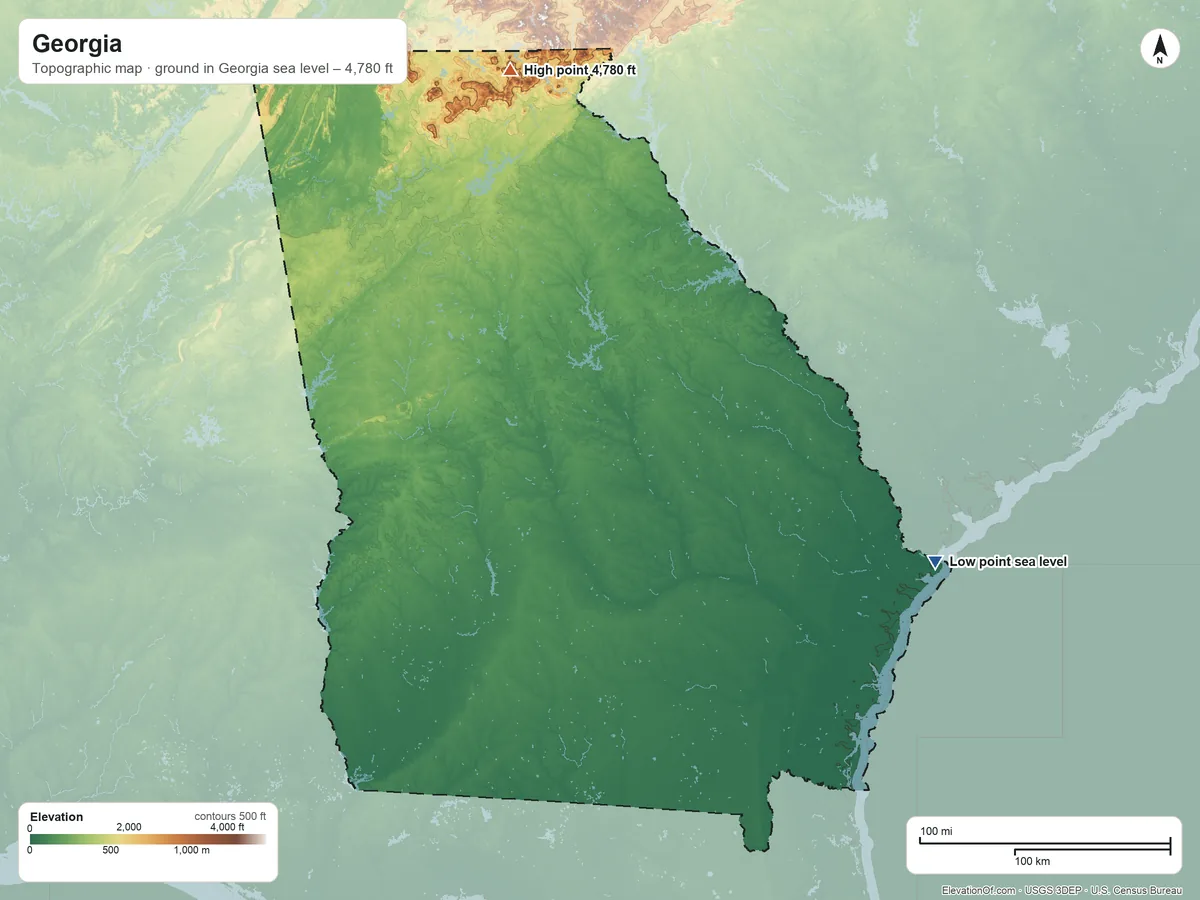
Georgia averages about 510 ft (155 m) above sea level across all its land. Its ground runs from sea level on the Atlantic Ocean to 4,780 ft on Brasstown Bald.
Average elevation
510 ft 155 m
all land in Georgia
Highest
4,780 ft 1,455 m
on Brasstown Bald
Lowest
0 ft 0 m
at sea level on the Atlantic Ocean
Georgia spans about 4,780 ft of height, so no single spot tells the whole story. The ruler shows where most of its land lies, and where the other numbers you'll see come from.
Under 1% of Georgia's land lies below the average daily high tide (MHHW, NOAA), and under 1% lies less than 3 ft above it. Check flood zones on FEMA's map
| Figure | Elevation |
|---|---|
| Average of all land | 510 ft155 m |
| Highest point In Georgia, on Brasstown Bald (3DEP terrain model; no NGS survey height) | 4,780 ft1,455 m |
| Lowest point Where the land meets the Atlantic Ocean | 0 ft0 m |
Elevation profile, south to north
297 mi south to north through Atlanta.
Topographic Map
- Location
- State in the South Atlantic division of the South region, United States
- Population
- 11,180,878 2024 est.
- Land area
- 57,717.6 sq mi + 1,705.4 sq mi water
- Density
- 194 per sq mi
- Counties
- 151
- Time zone
- Eastern UTC−5 / −4
- Landform regions
- Coastal Plain 61%, Piedmont 30%
- Drains to
- Gulf of America 54%, Atlantic Ocean 46%
⤓ Download this map
WebP, 1200 × 900. Free to use: credit “ElevationOf.com” with a link to this page.
Sources: U.S. Census Bureau, USGS
Nearby Places
Neighboring states sharing a border, by average
- Tennessee950 ft
- North Carolina770 ft
- Georgia510 ft
- Alabama460 ft
- South Carolina330 ft
- Florida63 ft
Rankings by average elevation
- States in the United States41st highest of 52
Peaks and hills highest inside
- Brasstown Bald4,780 ft
- Blood Mountain4,459 ft
- Tray Mountain4,400 ft
- Cowpen Mountain4,151 ft
- Big Bald Mountain4,080 ft
All 151 counties by average elevation
- Towns County2,570 ft
- Union County2,370 ft
- Rabun County2,310 ft
- Fannin County2,120 ft
- Gilmer County1,830 ft
- White County1,780 ft
- Lumpkin County1,680 ft
- Habersham County1,540 ft
- Dawson County1,500 ft
- Pickens County1,410 ft
- Dade County1,290 ft
- Haralson County1,160 ft
- Forsyth County1,150 ft
- Hall County1,140 ft
- Murray County1,090 ft
- Walker County1,090 ft
- Cherokee County1,080 ft
- Carroll County1,070 ft
- Paulding County1,040 ft
- Douglas County1,000 ft
- Cobb County1,000 ft
- Gwinnett County990 ft
- Fulton County940 ft
- DeKalb County920 ft
- Stephens County920 ft
- Polk County920 ft
- Clayton County880 ft
- Chattooga County880 ft
- Banks County870 ft
- Barrow County870 ft
- Fayette County860 ft
- Bartow County850 ft
- Catoosa County850 ft
- Whitfield County850 ft
- Heard County840 ft
- Coweta County840 ft
- Meriwether County820 ft
- Spalding County810 ft
- Jackson County810 ft
- Walton County810 ft
- Pike County810 ft
- Rockdale County790 ft
- Henry County780 ft
- Hart County760 ft
- Franklin County750 ft
- Gordon County750 ft
- Floyd County740 ft
- Lamar County740 ft
- Troup County730 ft
- Madison County710 ft
- Newton County700 ft
- Harris County700 ft
- Oconee County690 ft
- Upson County660 ft
- Butts County630 ft
- Talbot County630 ft
- Morgan County610 ft
- Oglethorpe County610 ft
- Jasper County570 ft
- Greene County570 ft
- Elbert County560 ft
- Marion County560 ft
- Monroe County550 ft
- Taliaferro County540 ft
- Taylor County510 ft
- Wilkes County500 ft
- Warren County490 ft
- Jones County490 ft
- Putnam County490 ft
- Schley County490 ft
- Crawford County480 ft
- Hancock County480 ft
- Peach County450 ft
- McDuffie County450 ft
- Glascock County430 ft
- Stewart County420 ft
- Lincoln County420 ft
- Baldwin County390 ft
- Twiggs County390 ft
- Randolph County390 ft
- Macon County380 ft
- Sumter County380 ft
- Columbia County370 ft
- Washington County360 ft
- Turner County360 ft
- Houston County360 ft
- Dooly County350 ft
- Bleckley County350 ft
- Crisp County340 ft
- Terrell County330 ft
- Jefferson County330 ft
- Wilkinson County330 ft
- Worth County330 ft
- Tift County320 ft
- Irwin County310 ft
- Johnson County310 ft
- Clay County300 ft
- Wilcox County300 ft
- Dodge County290 ft
- Ben Hill County290 ft
- Colquitt County280 ft
- Pulaski County270 ft
- Laurens County270 ft
- Lee County260 ft
- Burke County260 ft
- Emanuel County260 ft
- Treutlen County250 ft
- Calhoun County240 ft
- Berrien County240 ft
- Cook County230 ft
- Grady County230 ft
- Coffee County230 ft
- Jeff Davis County220 ft
- Mitchell County220 ft
- Early County210 ft
- Montgomery County210 ft
- Jenkins County210 ft
- Candler County210 ft
- Thomas County210 ft
- Telfair County210 ft
- Dougherty County200 ft
- Atkinson County200 ft
- Wheeler County190 ft
- Lanier County190 ft
- Bacon County180 ft
- Toombs County180 ft
- Brooks County180 ft
- Lowndes County180 ft
- Appling County170 ft
- Decatur County170 ft
- Baker County170 ft
- Miller County160 ft
- Bulloch County160 ft
- Clinch County150 ft
- Tattnall County150 ft
- Screven County150 ft
- Evans County140 ft
- Ware County140 ft
- Seminole County120 ft
- Pierce County110 ft
- Charlton County98 ft
- Wayne County90 ft
- Effingham County73 ft
- Brantley County72 ft
- Long County63 ft
- Bryan County43 ft
- Liberty County36 ft
- Camden County14 ft
- McIntosh County11 ft
- Chatham County10 ft
- Glynn County10 ft
All 2 tribal lands by average elevation
How we measure
- Average: every USGS 3DEP bare-earth cell of land inside the Census state boundary (TIGER/Line, Jan 1 2026), weighted equally, on a 7 arc-second (≈710 ft, 216 m) grid, coarsened from 1 arc-second so the whole area fits one run. Land means the boundary minus Census area water (on this grid, water areas of at least half a cell).
- Highest and lowest: the highest land cell, re-read at 1 arc-second around the 25 highest grid cells; it is a named summit, so its height is the peak method: the 3DEP top on a ~7 ft (2 m) window, or the NGS published height when a survey mark sits within 160 ft (50 m) of it. Lowest: the lowest land cell, re-read at 1 arc-second around the 25 lowest grid cells; coastal ground within 3 ft (1 m) of named tidal water counts as sea level.
- Pits: the lowest point is the lowest ground outside closed hollows (quarry floors, mine pits, terrain-model artifacts): any hollow under 0.4 sq mi (1 km²), and any hollow under 2 sq mi (5 km²) whose floor is more than 100 ft (30 m) below its rim; and outside patches below sea level of under 0.4 sq mi (1 km²). The single lowest 3DEP cell, −190 ft at 33.5385° N, 82.0387° W, is in such a hollow or patch and is not counted; this coastal land's lowest point is sea level on the coast.
- Nearby Places: neighboring states and rankings use each one's average elevation, on its own grid, the same figure its page shows. Peaks and hills: the highest summits inside the state with at least 980 ft (300 m) of prominence, then the highest federal (GNIS) summits inside it when there are fewer than 5; each is the 3DEP top on a ~7 ft (2 m) window, or the NGS published height when a usable survey mark sits within 160 ft (50 m) of it (shown as published).
- Counties: each one's average on its own grid (1 arc-second, coarser for the largest), the same figure its own page shows.
- Rounding: computed heights are rounded to 10 ft (5 m), or to 1 ft (1 m) under 100 ft; 3DEP is good to about a meter, not a foot. Published figures (NGS survey heights) are shown as their publisher gives them.
- Datum: North American Vertical Datum of 1988 (NAVD 88). NGS plans to replace NAVD 88 with a new datum (NAPGD2022); heights will then shift slightly.
- Sources: USGS 3DEP, GNIS, Watershed Boundary Dataset and physiographic provinces; U.S. Census Bureau (TIGER boundaries and water, 2020 blocks, 2024 population estimates, county adjacency); NOAA NGS survey heights; BTS time zones; NOAA tidal surfaces (MHHW). All public domain.