Suffolk County, NY Elevation & Topographic Map
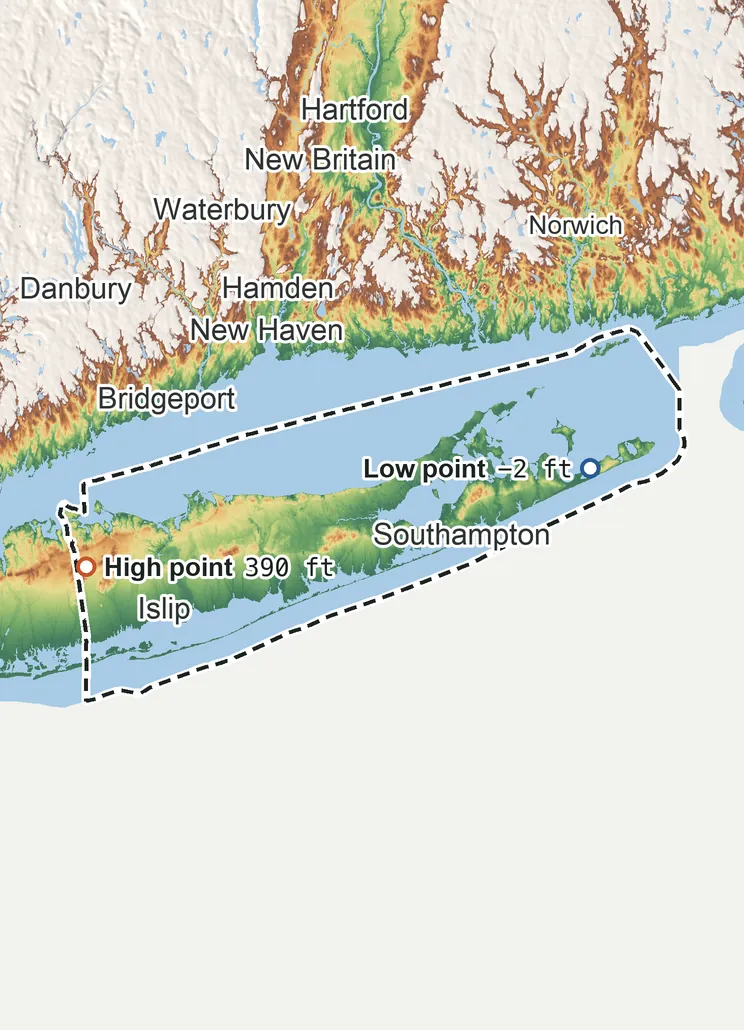
Elevation
400 ft 120 m300 ft 90 m250 ft 75 m150 ft 45 m48 ft 15 m−2 ft −1 m
Zoom in for contour lines
USGS 3DEP · U.S. Census Bureau
How to use this mapviews, tools and data
- Elevation
- Ground colored by height from green (lowest) to white (highest), with contour lines every 40–500 ft (USGS data).
- Satellite
- A 2016 satellite photo at 33 ft (10 m) detail; contours off.
- 3D
- Tilt and turn the terrain; hills are raised 1.5×, or set ×1 for true height.
- Click or tap anywhere
- The exact elevation of that spot in ft and m.
- Measure
- Pick two points for the climb, descent and grade along a straight line.
- County area
- Fades everything outside the official county boundary (US Census).
Elevation Data
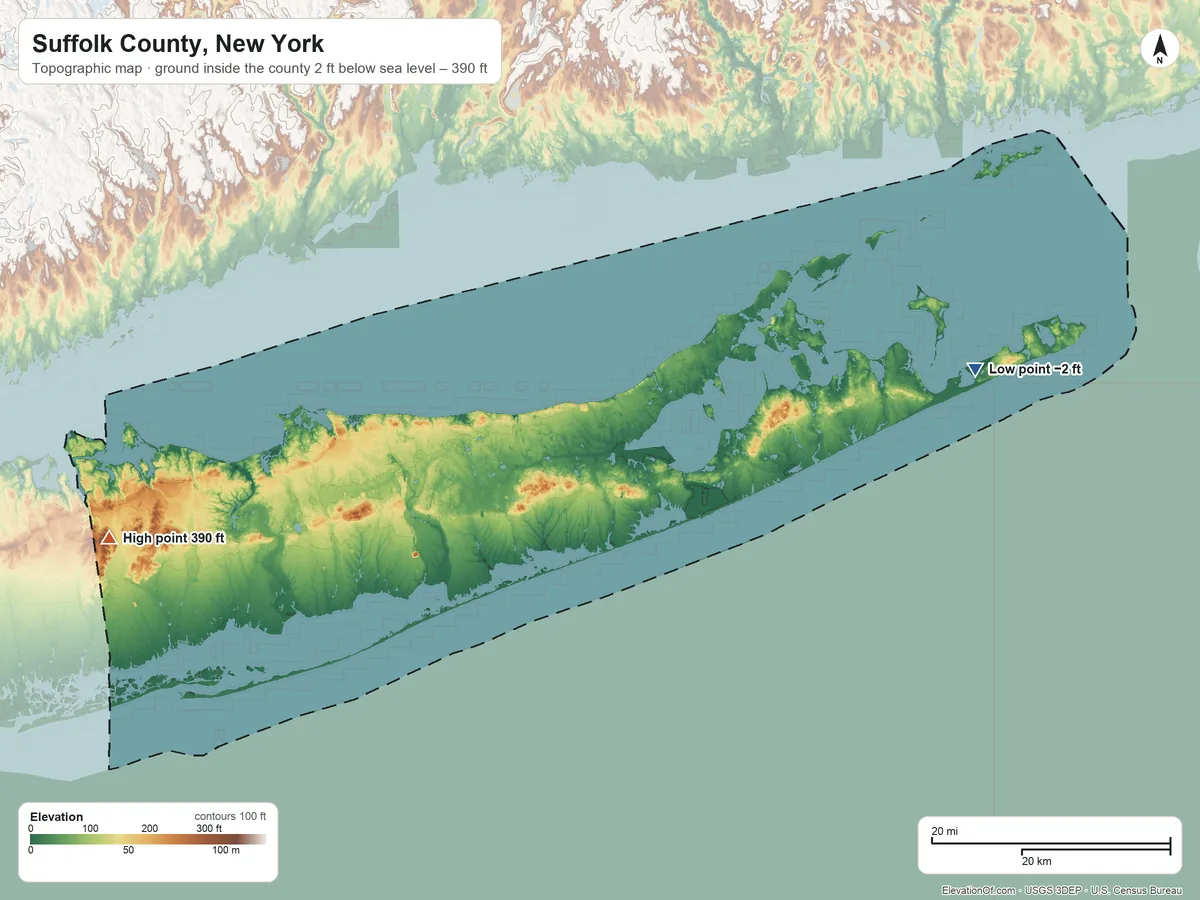
Suffolk County averages about 73 ft (22 m) above sea level across all its land. Its ground runs from 2 ft below sea level on the east side to 390 ft on High Hill.
Average elevation
73 ft 22 m
all land inside the county
Highest
390 ft 120 m
on High Hill
Lowest
−2 ft −1 m
on the east side
Suffolk County spans about 392 ft of height, so no single spot tells the whole story. The ruler shows where most of its land lies, and where the other numbers you'll see come from.
| Figure | Elevation |
|---|---|
| Average of all land | 73 ft22 m |
| Highest point Inside the county, on High Hill (3DEP terrain model; no NGS survey height) | 390 ft120 m |
| Lowest point Inside the county, on the east side | −2 ft−1 m |
Elevation profile, west to east
49 mi west to east through Brookhaven.
Topographic Map
- Location
- County in New York, United States
- Population
- 1,535,909 2024 est.
- Land area
- 910.9 sq mi + 1,462.4 sq mi water
- Density
- 1,686 per sq mi
- Time zone
- Eastern UTC−5 / −4
- Landform region
- Coastal Plain 95%
- Drains to
- Atlantic Ocean 92%
⤓ Download this map
WebP, 1200 × 900. Free to use: credit “ElevationOf.com” with a link to this page.
Sources: U.S. Census Bureau, USGS
Nearby Places
Neighboring counties sharing a border, by average
- Fairfield County, CT380 ft
- New Haven County, CT310 ft
- Middlesex County, CT280 ft
- New London County, CT250 ft
- Washington County, RI150 ft
- Nassau County89 ft
- Suffolk County73 ft
Rankings by average elevation
- Counties in New York57th highest of 62
- Counties in the United States2,977th highest of 3,151
Peaks and hills highest inside
- High Hill, Suffolk County390 ft
- Dix Hills350 ft
- Signal Hill, Suffolk County320 ft
- Bald Hill, Suffolk County294 ft
- Rock Hill, Suffolk County260 ft
All 162 towns in Suffolk County by typical elevation
- Greenlawn210 ft
- East Northport200 ft
- West Hills200 ft
- South Huntington190 ft
- Huntington Station190 ft
- Elwood190 ft
- Dix Hills180 ft
- Huntington180 ft
- Cold Spring Harbor180 ft
- Port Jefferson Station180 ft
- Farmingville160 ft
- Head of the Harbor160 ft
- Port Jefferson150 ft
- Commack150 ft
- Kings Park150 ft
- Melville150 ft
- Sound Beach150 ft
- Terryville150 ft
- Mount Sinai150 ft
- Gordon Heights140 ft
- Stony Brook University140 ft
- Rocky Point140 ft
- Stony Brook140 ft
- Miller Place140 ft
- East Setauket140 ft
- Belle Terre140 ft
- St. James130 ft
- East Shoreham130 ft
- Northport130 ft
- Centerport120 ft
- Smithtown120 ft
- Shoreham120 ft
- Baiting Hollow120 ft
- Coram120 ft
- Selden110 ft
- Lloyd Harbor110 ft
- Lake Ronkonkoma110 ft
- Lake Grove110 ft
- Centereach110 ft
- Fort Salonga100 ft
- Brookhaven100 ft
- Wading River100 ft
- Nesconset100 ft
- Holtsville94 ft
- Ridge94 ft
- Brentwood93 ft
- Medford92 ft
- Nissequogue92 ft
- Ronkonkoma91 ft
- Halesite89 ft
- Yaphank87 ft
- Middle Island87 ft
- Wheatley Heights85 ft
- Hauppauge82 ft
- Manorville78 ft
- Holbrook78 ft
- Islandia74 ft
- East Farmingdale69 ft
- Central Islip68 ft
- Deer Park68 ft
- North Bay Shore67 ft
- Huntington Bay67 ft
- Wyandanch63 ft
- Northwest Harbor61 ft
- Eatons Neck59 ft
- Baywood59 ft
- Village of the Branch56 ft
- Bridgehampton56 ft
- Poquott56 ft
- Bohemia55 ft
- Calverton54 ft
- Noyack54 ft
- North Bellport53 ft
- East Hampton North52 ft
- Islip52 ft
- Northville50 ft
- Old Field49 ft
- Setauket49 ft
- Montauk47 ft
- North Patchogue43 ft
- Tuckahoe, Suffolk County43 ft
- Shinnecock Hills42 ft
- North Amityville41 ft
- Mastic41 ft
- Shirley41 ft
- Riverhead40 ft
- North Great River40 ft
- East Hampton40 ft
- North Babylon39 ft
- North Lindenhurst39 ft
- Amagansett39 ft
- North Sea38 ft
- West Babylon38 ft
- Babylon37 ft
- Village of Southampton36 ft
- Hampton Bays36 ft
- Wainscott35 ft
- Water Mill33 ft
- Village of East Hampton33 ft
- Westhampton31 ft
- Eastport31 ft
- Islip Terrace31 ft
- Northampton, Suffolk County31 ft
- East Moriches31 ft
- East Marion31 ft
- Southampton30 ft
- Sayville29 ft
- Bay Shore29 ft
- Sag Harbor29 ft
- Springs29 ft
- East Patchogue28 ft
- Moriches28 ft
- Sagaponack26 ft
- Aquebogue26 ft
- Cutchogue26 ft
- Shelter Island25 ft
- Dering Harbor25 ft
- Bellport25 ft
- Shelter Island Heights25 ft
- East Quogue24 ft
- Mattituck24 ft
- West Bay Shore24 ft
- Quiogue23 ft
- Remsenburg-Speonk23 ft
- Brightwaters23 ft
- Bayport22 ft
- West Islip22 ft
- Center Moriches22 ft
- Westhampton Beach21 ft
- Laurel21 ft
- Peconic20 ft
- West Sayville20 ft
- Fishers Island20 ft
- New Suffolk20 ft
- East Islip19 ft
- Southold18 ft
- North Haven18 ft
- Flanders18 ft
- Asharoken18 ft
- Lindenhurst18 ft
- Riverside18 ft
- Blue Point17 ft
- Jamesport17 ft
- Amityville17 ft
- Great River16 ft
- Patchogue16 ft
- Quogue16 ft
- Copiague15 ft
- Mastic Beach14 ft
- Greenport West12 ft
- Village of Babylon11 ft
- Village of Greenport10 ft
- Orient10 ft
- Oakdale8 ft
- West Hampton Dunes6 ft
- Napeague5 ft
- Fire Island4 ft
- Ocean Beach3 ft
- Saltaire3 ft
- Gilgo1 ft
- Captree1 ft
- Oak Beach−1 ft
How we measure
- Average: every USGS 3DEP bare-earth cell of land inside the Census county boundary (TIGER/Line, Jan 1 2026), weighted equally, on a 2 arc-second (≈200 ft, 62 m) grid, coarsened from 1 arc-second so the whole area fits one run. Land means the boundary minus Census area water (on this grid, water areas of at least half a cell).
- Highest and lowest: the highest land cell, re-read at 1 arc-second around the 25 highest grid cells; it is a named summit, so its height is the peak method: the 3DEP top on a ~7 ft (2 m) window, or the NGS published height when a survey mark sits within 160 ft (50 m) of it. Lowest: the lowest land cell, re-read at 1 arc-second around the 25 lowest grid cells; coastal ground within 3 ft (1 m) of named tidal water counts as sea level.
- Pits: the lowest point is the lowest ground outside closed hollows (quarry floors, mine pits, terrain-model artifacts): any hollow under 0.4 sq mi (1 km²), and any hollow under 2 sq mi (5 km²) whose floor is more than 100 ft (30 m) below its rim; and outside patches below sea level of under 0.4 sq mi (1 km²). The single lowest 3DEP cell, −4 ft at 41.0426° N, 71.9007° W, is in such a hollow or patch and is not counted.
- Nearby Places: neighboring counties and rankings use each one's average elevation, on its own grid, the same figure its page shows. Peaks and hills: the highest summits inside the county with at least 980 ft (300 m) of prominence, then the highest federal (GNIS) summits inside it when there are fewer than 5; each is the 3DEP top on a ~7 ft (2 m) window, or the NGS published height when a usable survey mark sits within 160 ft (50 m) of it (shown as published).
- Towns: each town's typical elevation (population-weighted median of its own 2020 blocks at 1 arc-second); a town is listed when any of its 2020 residents live in the county.
- Rounding: computed heights are rounded to 10 ft (5 m), or to 1 ft (1 m) under 100 ft; 3DEP is good to about a meter, not a foot. Published figures (NGS survey heights) are shown as their publisher gives them.
- Datum: North American Vertical Datum of 1988 (NAVD 88). NGS plans to replace NAVD 88 with a new datum (NAPGD2022); heights will then shift slightly.
- Sources: USGS 3DEP, GNIS, Watershed Boundary Dataset and physiographic provinces; U.S. Census Bureau (TIGER boundaries and water, 2020 blocks, 2024 population estimates, county adjacency); NOAA NGS survey heights; BTS time zones. All public domain.