St. Louis County, MN Elevation & Topographic Map
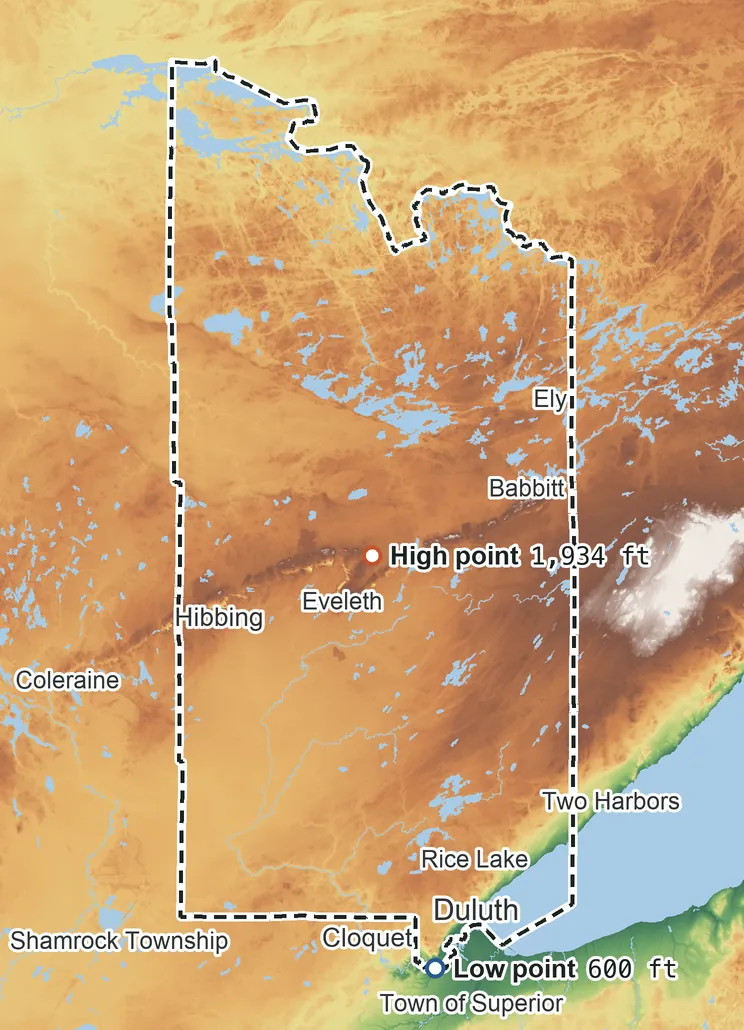
Elevation
1,930 ft 590 m1,600 ft 490 m1,430 ft 435 m1,100 ft 335 m770 ft 235 m600 ft 185 m
Zoom in for contour lines
USGS 3DEP · U.S. Census Bureau
How to use this mapviews, tools and data
- Elevation
- Ground colored by height from green (lowest) to white (highest), with contour lines every 40–500 ft (USGS data).
- Satellite
- A 2016 satellite photo at 33 ft (10 m) detail; contours off.
- 3D
- Tilt and turn the terrain; hills are raised 1.5×, or set ×1 for true height.
- Click or tap anywhere
- The exact elevation of that spot in ft and m.
- Measure
- Pick two points for the climb, descent and grade along a straight line.
- County area
- Fades everything outside the official county boundary (US Census).
Elevation Data
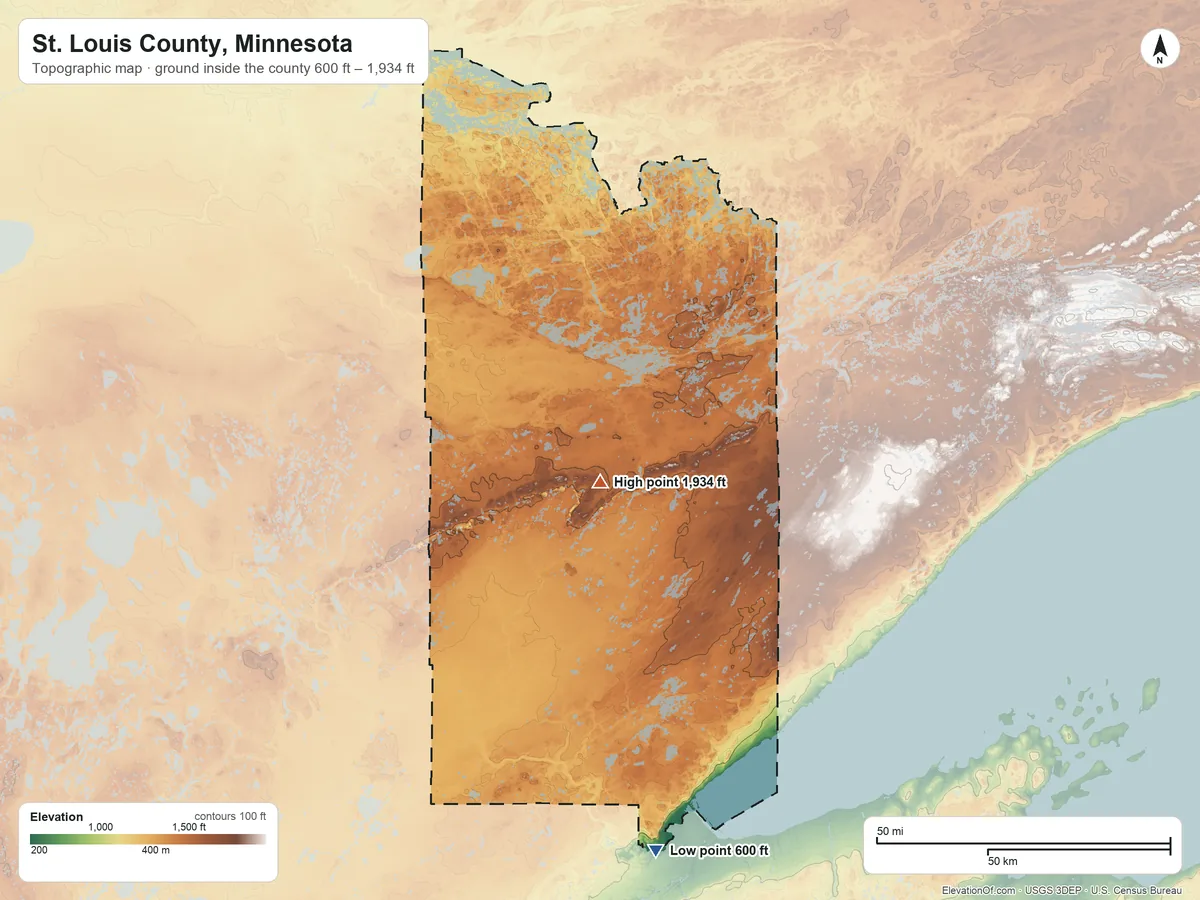
St. Louis County averages about 1,380 ft (420 m) above sea level across all its land. Its ground runs from 600 ft on the south side to 1,934 ft on Pike Mountain.
Average elevation
1,380 ft 420 m
all land inside the county
Highest
1,934 ft 589 m
on Pike Mountain
Lowest
600 ft 185 m
on the south side
St. Louis County spans about 1,330 ft of height, so no single spot tells the whole story. The ruler shows where most of its land lies, and where the other numbers you'll see come from.
| Figure | Elevation |
|---|---|
| Average of all land | 1,380 ft420 m |
| Highest point Inside the county, on Pike Mountain (NGS survey height) | 1,934 ft589 m |
| Lowest point Inside the county, on the south side | 600 ft185 m |
Elevation profile, south to north
111 mi south to north through Duluth.
Topographic Map
- Location
- County in Minnesota, United States
- Population
- 200,794 2024 est.
- Land area
- 6,248.1 sq mi + 612.4 sq mi water
- Density
- 32 per sq mi
- Time zone
- Central UTC−6 / −5
- Landform region
- Superior Upland
- Drains to
- Great Lakes 50%, Canada 50%
⤓ Download this map
WebP, 1200 × 900. Free to use: credit “ElevationOf.com” with a link to this page.
Sources: U.S. Census Bureau, USGS
Nearby Places
Neighboring counties sharing a border, by average
- Lake County1,570 ft
- St. Louis County1,380 ft
- Itasca County1,360 ft
- Aitkin County1,270 ft
- Koochiching County1,220 ft
- Carlton County1,190 ft
- Douglas County, WI1,060 ft
Rankings by average elevation
- Counties in Minnesota12th highest of 87
- Counties in the United States927th highest of 3,151
Peaks and hills highest inside
- Pike Mountain1,934 ft
- Lookout Mountain, St. Louis County1,850 ft
- Jasper Peak1,700 ft
- Moose Mountain, St. Louis County1,660 ft
- Maple Hill, St. Louis County1,650 ft
All 103 towns in St. Louis County by typical elevation
- Bassett Township1,650 ft
- Eveleth1,610 ft
- Fairbanks Township1,590 ft
- Gilbert1,560 ft
- Kinney1,550 ft
- Buhl1,520 ft
- Chisholm1,520 ft
- Ault Township1,510 ft
- Eagles Nest Township1,510 ft
- Balkan Township1,500 ft
- Hibbing1,490 ft
- Babbitt1,490 ft
- Pequaywan Township1,490 ft
- McKinley1,480 ft
- North Star Township, St. Louis County1,480 ft
- Hoyt Lakes1,480 ft
- Sandy Township1,470 ft
- Wuori Township1,470 ft
- Aurora1,460 ft
- Biwabik1,460 ft
- Soudan1,460 ft
- Kugler Township1,450 ft
- Leonidas1,450 ft
- Ely1,450 ft
- White Township1,450 ft
- Morse Township1,440 ft
- Pike Township1,440 ft
- Waasa Township1,440 ft
- Virginia1,440 ft
- Embarrass Township1,440 ft
- Colvin Township1,440 ft
- Vermilion Lake Township1,440 ft
- Mountain Iron1,430 ft
- Canosia Township1,430 ft
- Breitung Township1,430 ft
- Great Scott Township1,420 ft
- Tower1,390 ft
- Beatty Township1,390 ft
- Rice Lake1,390 ft
- French Township1,390 ft
- Fayal Township1,390 ft
- Hermantown1,380 ft
- Biwabik Township1,380 ft
- Fredenberg Township1,380 ft
- Ellsburg Township1,380 ft
- Grand Lake Township1,380 ft
- Greenwood Township1,380 ft
- Goodwill Township1,380 ft
- Orr1,380 ft
- Gnesen Township1,380 ft
- Cherry Township1,370 ft
- Clinton Township1,370 ft
- Iron Junction1,370 ft
- Camp 5 Township1,360 ft
- Solway Township1,360 ft
- Angora Township1,360 ft
- Northland Township1,350 ft
- Alango Township1,340 ft
- Arrowhead Township1,340 ft
- New Independence Township1,340 ft
- Willow Valley Township1,340 ft
- Cotton Township1,340 ft
- Industrial Township1,330 ft
- Winton1,330 ft
- McDavitt Township1,330 ft
- Leiding Township1,330 ft
- Alborn Township1,330 ft
- Owens Township1,320 ft
- Cook1,310 ft
- Field Township1,310 ft
- Sturgeon Township1,310 ft
- Culver Township1,310 ft
- Stoney Brook Township1,310 ft
- Normanna Township1,310 ft
- Lavell Township1,300 ft
- Kelsey Township1,300 ft
- Brevator Township1,300 ft
- Fine Lakes Township1,300 ft
- Linden Grove Township1,300 ft
- Portage Township1,300 ft
- Nett Lake1,300 ft
- Morcom Township1,290 ft
- Mahnomen, St. Louis County1,290 ft
- Toivola Township1,280 ft
- Meadowlands Township1,280 ft
- Prairie Lake Township1,280 ft
- Meadowlands1,280 ft
- Halden Township1,270 ft
- Elmer Township, St. Louis County1,270 ft
- Midway Township1,270 ft
- Cedar Valley Township1,270 ft
- Floodwood Township1,270 ft
- Ness Township1,270 ft
- Proctor1,270 ft
- Floodwood1,260 ft
- Van Buren Township1,250 ft
- Alden Township, St. Louis County1,240 ft
- Brookston1,240 ft
- Kabetogama Township1,200 ft
- Crane Lake Township1,180 ft
- Lakewood Township1,150 ft
- Duluth Township980 ft
- Duluth860 ft
How we measure
- Average: every USGS 3DEP bare-earth cell of land inside the Census county boundary (TIGER/Line, Jan 1 2026), weighted equally, on a 3 arc-second (≈300 ft, 93 m) grid, coarsened from 1 arc-second so the whole area fits one run. Land means the boundary minus Census area water (on this grid, water areas of at least half a cell).
- Highest and lowest: the highest land cell, re-read at 1 arc-second around the 25 highest grid cells. Lowest: the lowest land cell, re-read at 1 arc-second around the 25 lowest grid cells; coastal ground within 3 ft (1 m) of named tidal water counts as sea level.
- Highest ground: the single highest 3DEP cell, 1,940 ft at 47.5574° N, 92.4304° W, has no federal (GNIS) summit name within 980 ft (300 m), so the high point shown is the highest of the 25 highest cells with a GNIS summit within 1,640 ft (500 m).
- Nearby Places: neighboring counties and rankings use each one's average elevation, on its own grid, the same figure its page shows. Peaks and hills: the highest summits inside the county with at least 980 ft (300 m) of prominence, then the highest federal (GNIS) summits inside it when there are fewer than 5; each is the 3DEP top on a ~7 ft (2 m) window, or the NGS published height when a usable survey mark sits within 160 ft (50 m) of it (shown as published).
- Towns: each town's typical elevation (population-weighted median of its own 2020 blocks at 1 arc-second); a town is listed when any of its 2020 residents live in the county.
- Rounding: computed heights are rounded to 10 ft (5 m), or to 1 ft (1 m) under 100 ft; 3DEP is good to about a meter, not a foot. Published figures (NGS survey heights) are shown as their publisher gives them.
- Datum: North American Vertical Datum of 1988 (NAVD 88). NGS plans to replace NAVD 88 with a new datum (NAPGD2022); heights will then shift slightly.
- Sources: USGS 3DEP, GNIS, Watershed Boundary Dataset and physiographic provinces; U.S. Census Bureau (TIGER boundaries and water, 2020 blocks, 2024 population estimates, county adjacency); NOAA NGS survey heights; BTS time zones. All public domain.