Walnut Creek, CA Elevation & Topographic Map
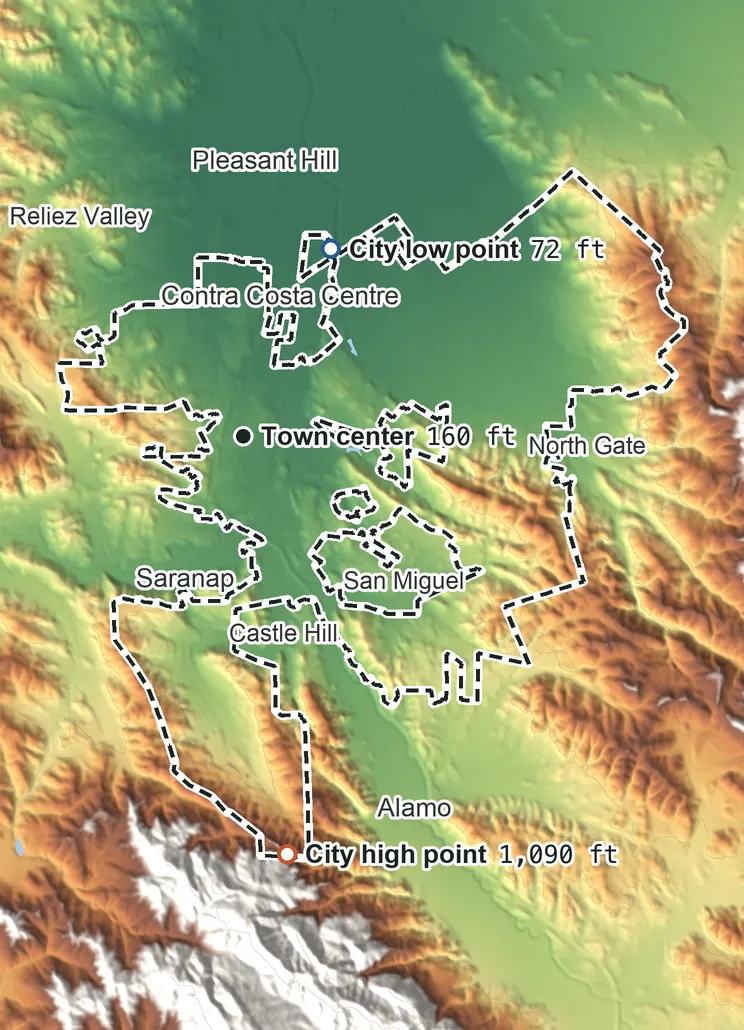
Elevation
1,090 ft 335 m840 ft 255 m710 ft 215 m460 ft 140 m200 ft 60 m72 ft 22 m
Contours every 200 ft, bold every 1,000 ft
USGS 3DEP · U.S. Census Bureau
How to use this mapviews, tools and data
- Elevation
- Ground colored by height from green (lowest) to white (highest), with contour lines every 40–500 ft (USGS data).
- Satellite
- A 2016 satellite photo at 33 ft (10 m) detail; contours off.
- 3D
- Tilt and turn the terrain; hills are raised 1.5×, or set ×1 for true height.
- Click or tap anywhere
- The exact elevation of that spot in ft and m.
- Measure
- Pick two points for the climb, descent and grade along a straight line.
- City area
- Fades everything outside the official city limits (US Census).
Elevation Data
Walnut Creek sits at about 170 ft (50 m) above sea level, worked out from 2020 Census block heights on USGS 3DEP, weighted by residents.
Typical elevation
170 ft 50 m
most residents: 100–440 ft
Lowest
72 ft 22 m
on the northeast side
Highest
1,090 ft 335 m
at the foot of the San Leandro Hills
Average
310 ft 95 m
all land inside city limits
Walnut Creek spans about 1,018 ft of height, so no single spot tells the whole story. The ruler shows where its people live, and where the other numbers you'll see come from.
| Figure | Elevation |
|---|---|
| Typical Where people live: half of residents higher, half lower | 170 ft50 m |
| Highest point Inside city limits, at the foot of the San Leandro Hills | 1,090 ft335 m |
| Lowest point Inside city limits, on the northeast side | 72 ft22 m |
| Town center USGS map point for Walnut Creek | 160 ft50 m |
| Airport (OAK) FAA airport elevation, the highest point of its runways, 12 mi southwest of the city limits | 9 ft3 m |
| Average of all land | 310 ft95 m |
| Nearest peak Mount Diablo, 4.4 mi east of the city limits (NGS survey) | 3,864 ft1,178 m |
Elevation profile, south to north
5.9 mi south to north through the town center.
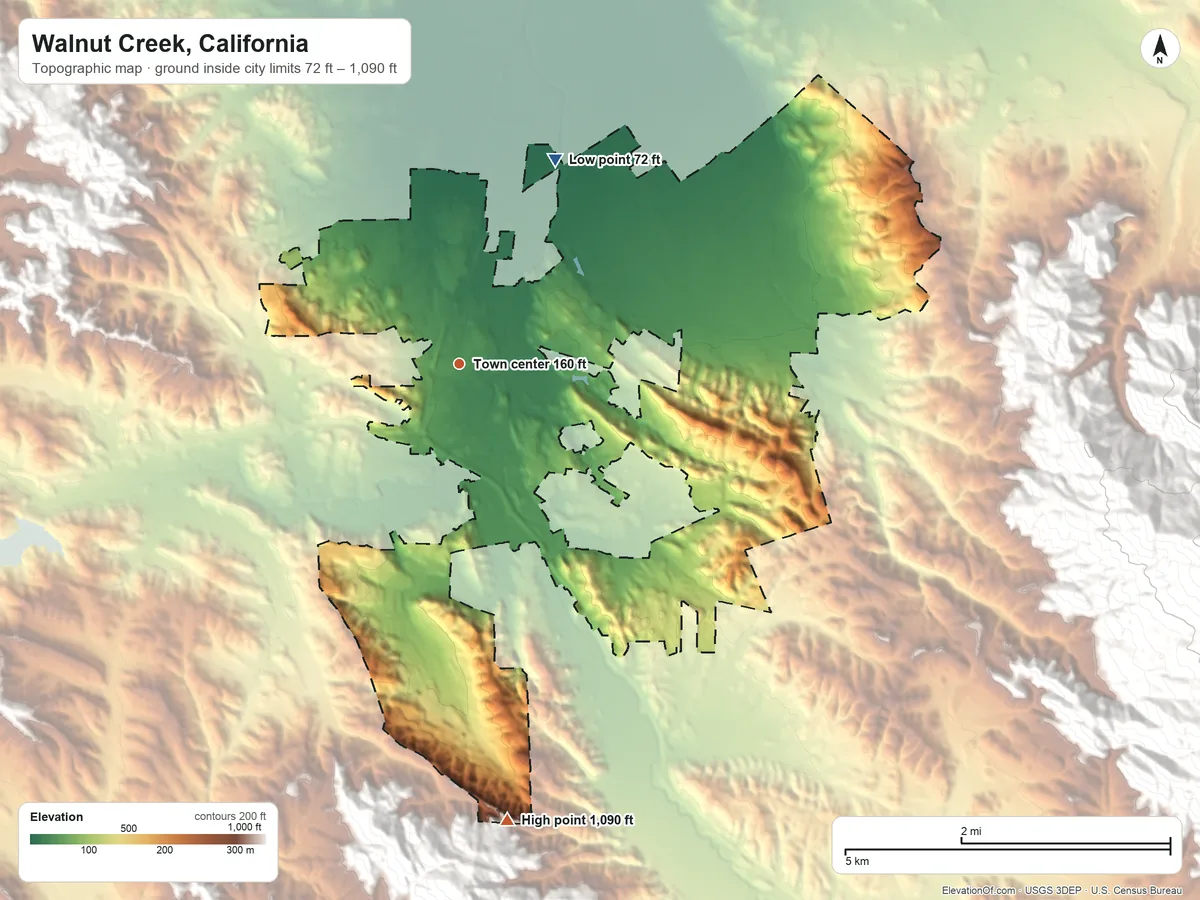
Topographic Map
- Location
- City in Contra Costa County, California, United States
- Population
- 70,817 2024 est.
- Land area
- 19.8 sq mi
- Density
- 3,584 per sq mi
- Coordinates
- 37.9063° N, 122.0650° W
- Time zone
- Pacific UTC−8 / −7
- Landform region
- Pacific Border
- Drains to
- Pacific Ocean
- Airport
- Oakland San Francisco Bay (OAK) 9 ft
- ZIP codes 5
- 94518 94595 94596 94597 94598
⤓ Download this map
WebP, 1200 × 900. Free to use: credit “ElevationOf.com” with a link to this page.
Sources: U.S. Census Bureau, USGS, FAA
Nearby Places
Nearby towns by typical elevation
- Lafayette450 ft
- Acalanes Ridge410 ft
- Castle Hill300 ft
- Reliez Valley290 ft
- North Gate270 ft
- San Miguel250 ft
- Shell Ridge230 ft
- Saranap200 ft
- Walnut Creek170 ft
- Contra Costa Centre88 ft
- Pleasant Hill72 ft
Rankings by typical elevation
- Towns in California1,161st highest of 1,622
- Towns in Contra Costa County23rd highest of 53
Peaks and hills nearest, by height
- Mount Diablo3,864 ft
- Mount Allison2,664 ft
- Sunol Peak2,191 ft
- Rocky Ridge2,020 ft
- Vollmer Peak1,916 ft
How we measure
- Typical elevation: the population-weighted median: every 2020 Census block inside the city limits, at its USGS 3DEP height, weighted by the people who live there. Half of residents live higher, half lower.
- Lowest, highest, average: USGS 3DEP bare-earth heights on a 1 arc-second (≈100 ft, 30 m) grid, land only, inside the Census city limits (TIGER, Jan 1 2026).
- Pits: the lowest point is the lowest ground outside closed hollows (quarry floors, mine pits, terrain-model artifacts): any hollow under 0.4 sq mi (1 km²), and any hollow under 2 sq mi (5 km²) whose floor is more than 100 ft (30 m) below its rim; and outside patches below sea level of under 0.4 sq mi (1 km²). The single lowest 3DEP cell, 71 ft at 37.9349° N, 122.0482° W, is in such a hollow or patch and is not counted.
- Nearby Places: nearby towns and rankings use each town's typical elevation, so every town is compared like for like. Rankings count every city, town, township and census-designated place, including places inside a town. Peaks and hills: the nearest summits with at least 980 ft (300 m) of prominence within 62 mi (100 km), then federal (GNIS) summits within 16 mi (25 km) when there are fewer than 5; each is the 3DEP top on a ~7 ft (2 m) window, or the NGS published height when a usable survey mark sits within 160 ft (50 m) of it (shown as published).
- Rounding: computed heights are rounded to 10 ft (5 m), or to 1 ft (1 m) under 100 ft; 3DEP is good to about a meter, not a foot. Published figures (FAA airport elevation, NGS survey heights) are shown as their publisher gives them.
- Datum: North American Vertical Datum of 1988 (NAVD 88). NGS plans to replace NAVD 88 with a new datum (NAPGD2022); heights will then shift slightly.
- Sources: USGS 3DEP, GNIS, Watershed Boundary Dataset and physiographic provinces; U.S. Census Bureau (boundaries, 2020 blocks, 2024 population estimates, Gazetteer areas, ZIP code areas); FAA airport data; BTS time zones; NOAA NGS survey heights. All public domain.