Barton County, MO Elevation & Topographic Map
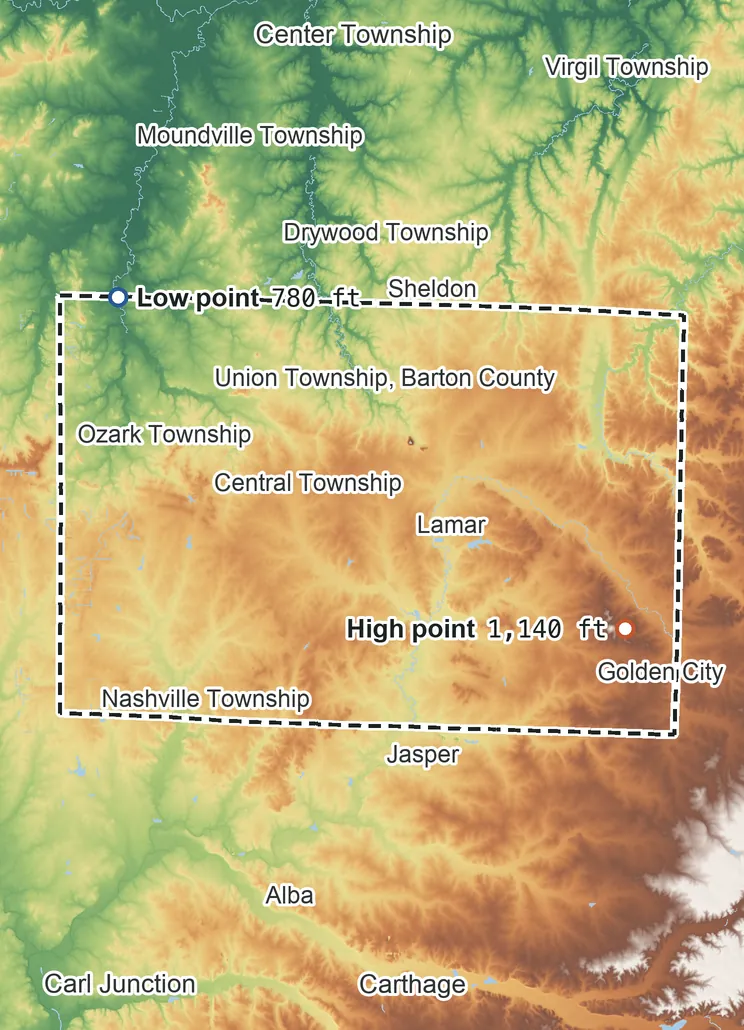
Elevation
1,140 ft 350 m1,050 ft 320 m1,010 ft 310 m920 ft 280 m830 ft 255 m780 ft 240 m
Contours every 500 ft, bold every 2,500 ft
USGS 3DEP · U.S. Census Bureau
How to use this mapviews, tools and data
- Elevation
- Ground colored by height from green (lowest) to white (highest), with contour lines every 40–500 ft (USGS data).
- Satellite
- A 2016 satellite photo at 33 ft (10 m) detail; contours off.
- 3D
- Tilt and turn the terrain; hills are raised 1.5×, or set ×1 for true height.
- Click or tap anywhere
- The exact elevation of that spot in ft and m.
- Measure
- Pick two points for the climb, descent and grade along a straight line.
- County area
- Fades everything outside the official county boundary (US Census).
Elevation Data
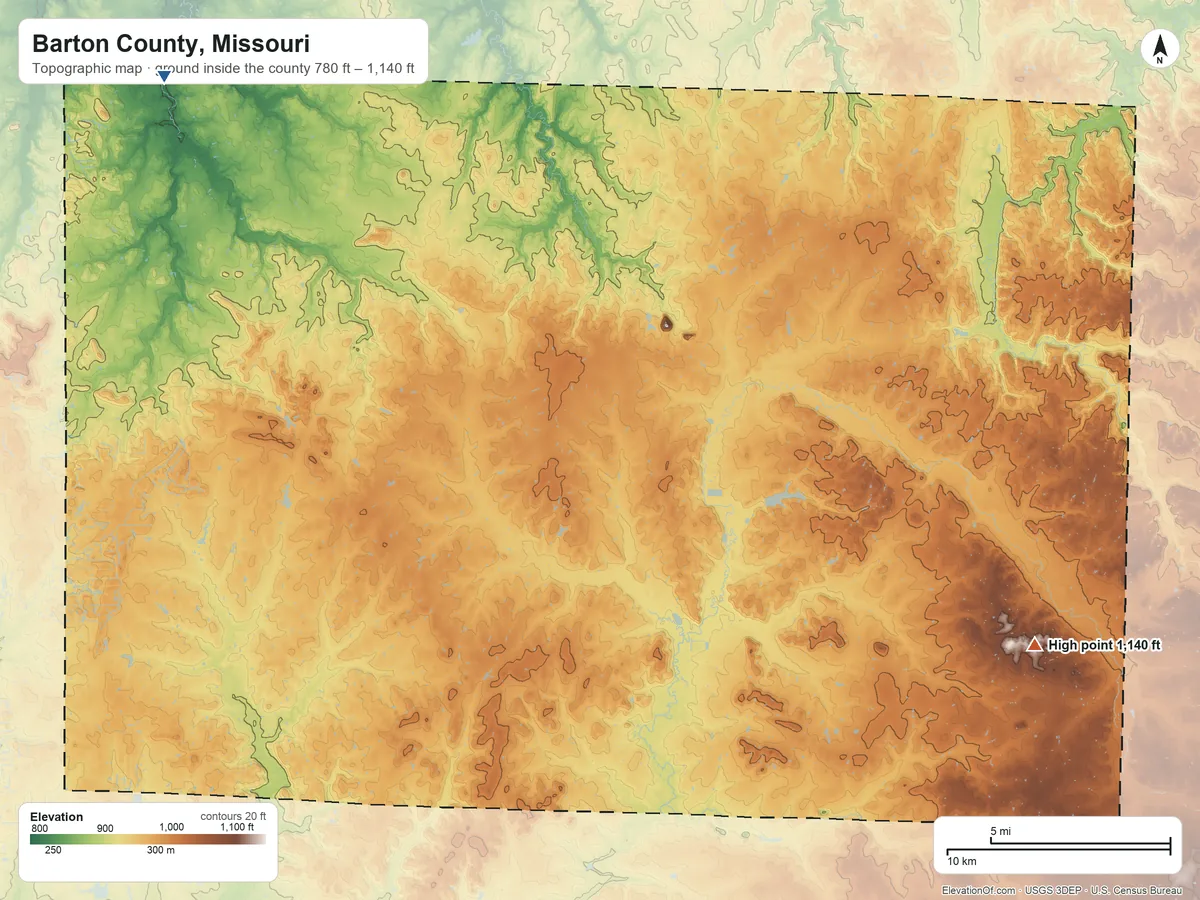
Barton County averages about 950 ft (290 m) above sea level across all its land. Its ground runs from 780 ft on the northwest side to 1,140 ft on the southeast side.
Average elevation
950 ft 290 m
all land inside the county
Highest
1,140 ft 350 m
on the southeast side
Lowest
780 ft 240 m
on the northwest side
Barton County spans about 360 ft of height, so no single spot tells the whole story. The ruler shows where most of its land lies, and where the other numbers you'll see come from.
| Figure | Elevation |
|---|---|
| Average of all land | 950 ft290 m |
| Highest point Inside the county, on the southeast side | 1,140 ft350 m |
| Lowest point Inside the county, on the northwest side | 780 ft240 m |
Elevation profile, west to east
30 mi west to east through Lamar.
Topographic Map
- Location
- County in Missouri, United States
- Population
- 11,717 2024 est.
- Land area
- 592.0 sq mi + 4.7 sq mi water
- Density
- 20 per sq mi
- Time zone
- Central UTC−6 / −5
- Landform region
- Central Lowland 95%
- Drains to
- Gulf of America
⤓ Download this map
WebP, 1200 × 900. Free to use: credit “ElevationOf.com” with a link to this page.
Sources: U.S. Census Bureau, USGS
Nearby Places
Neighboring counties sharing a border, by average
- Dade County1,030 ft
- Jasper County1,000 ft
- Barton County950 ft
- Crawford County, KS940 ft
- Cedar County910 ft
- Vernon County830 ft
Rankings by average elevation
- Counties in Missouri34th highest of 114
- Counties in the United States1,495th highest of 3,151
Peaks and hills highest inside
- Blue Mound, Barton County970 ft
- Haake Mound900 ft
All 23 towns in Barton County by typical elevation
- Golden City1,050 ft
- Golden City Township1,050 ft
- Newport Township1,000 ft
- Iantha990 ft
- Central Township980 ft
- Doylesport Township980 ft
- Lamar Township970 ft
- Mindenmines970 ft
- Irwin970 ft
- Nashville Township970 ft
- Richland Township, Barton County970 ft
- South West Township960 ft
- Lamar960 ft
- Lamar Heights960 ft
- Milford Township950 ft
- Northfork Township950 ft
- Milford920 ft
- Union Township, Barton County910 ft
- Ozark Township900 ft
- Liberal900 ft
- Barton City Township900 ft
- Burgess890 ft
- Leroy Township860 ft
How we measure
- Average: every USGS 3DEP bare-earth cell of land inside the Census county boundary (TIGER/Line, Jan 1 2026), weighted equally, on a 1 arc-second (≈100 ft, 30 m) grid. Land means the boundary minus Census area water.
- Highest and lowest: the highest land cell. Lowest: the lowest land cell; coastal ground within 3 ft (1 m) of named tidal water counts as sea level.
- Nearby Places: neighboring counties and rankings use each one's average elevation, on its own grid, the same figure its page shows. Peaks and hills: the highest summits inside the county with at least 980 ft (300 m) of prominence, then the highest federal (GNIS) summits inside it when there are fewer than 5; each is the 3DEP top on a ~7 ft (2 m) window, or the NGS published height when a usable survey mark sits within 160 ft (50 m) of it (shown as published).
- Towns: each town's typical elevation (population-weighted median of its own 2020 blocks at 1 arc-second); a town is listed when any of its 2020 residents live in the county.
- Rounding: computed heights are rounded to 10 ft (5 m), or to 1 ft (1 m) under 100 ft; 3DEP is good to about a meter, not a foot. Published figures (NGS survey heights) are shown as their publisher gives them.
- Datum: North American Vertical Datum of 1988 (NAVD 88). NGS plans to replace NAVD 88 with a new datum (NAPGD2022); heights will then shift slightly.
- Sources: USGS 3DEP, GNIS, Watershed Boundary Dataset and physiographic provinces; U.S. Census Bureau (TIGER boundaries and water, 2020 blocks, 2024 population estimates, county adjacency); NOAA NGS survey heights; BTS time zones. All public domain.