Kapaa Hawaiian Home Land, HI Elevation & Topographic Map
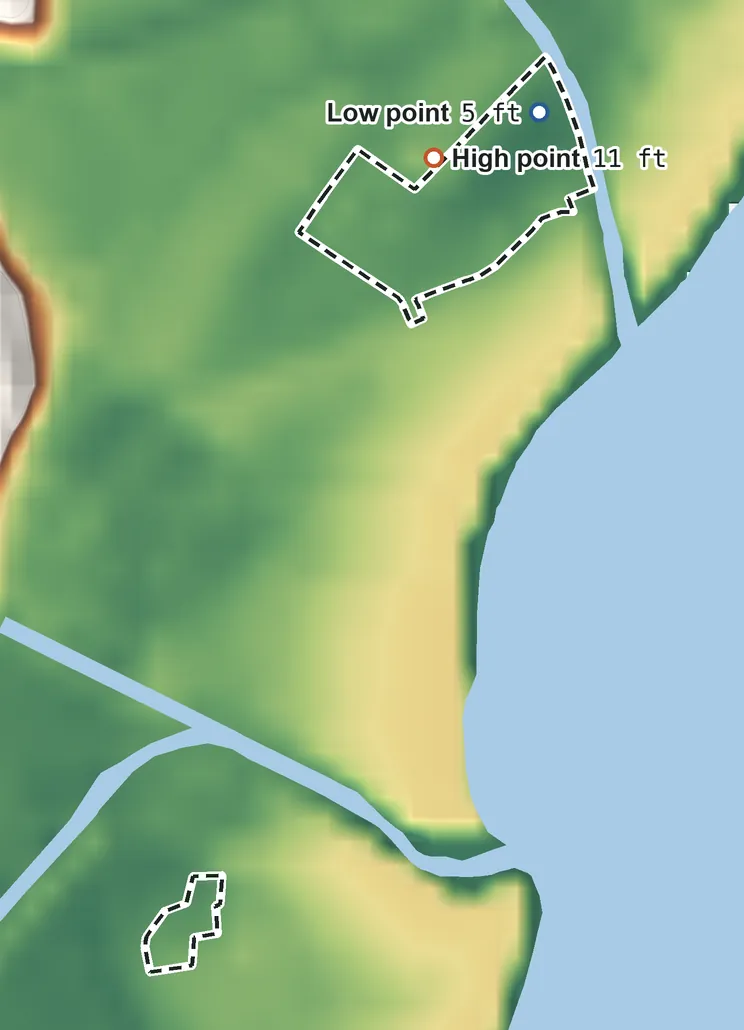
Elevation
38 ft 12 m30 ft 9 m25 ft 8 m17 ft 5 m9 ft 3 m5 ft 2 m
Contours every 40 ft, bold every 200 ft
USGS 3DEP · U.S. Census Bureau
How to use this mapviews, tools and data
- Elevation
- Ground colored by height from green (lowest) to white (highest), with contour lines every 40–500 ft (USGS data).
- Satellite
- A 2016 satellite photo at 33 ft (10 m) detail; contours off.
- 3D
- Tilt and turn the terrain; hills are raised 1.5×, or set ×1 for true height.
- Click or tap anywhere
- The exact elevation of that spot in ft and m.
- Measure
- Pick two points for the climb, descent and grade along a straight line.
- Area
- Fades everything outside the official home land boundary (US Census).
Elevation Data
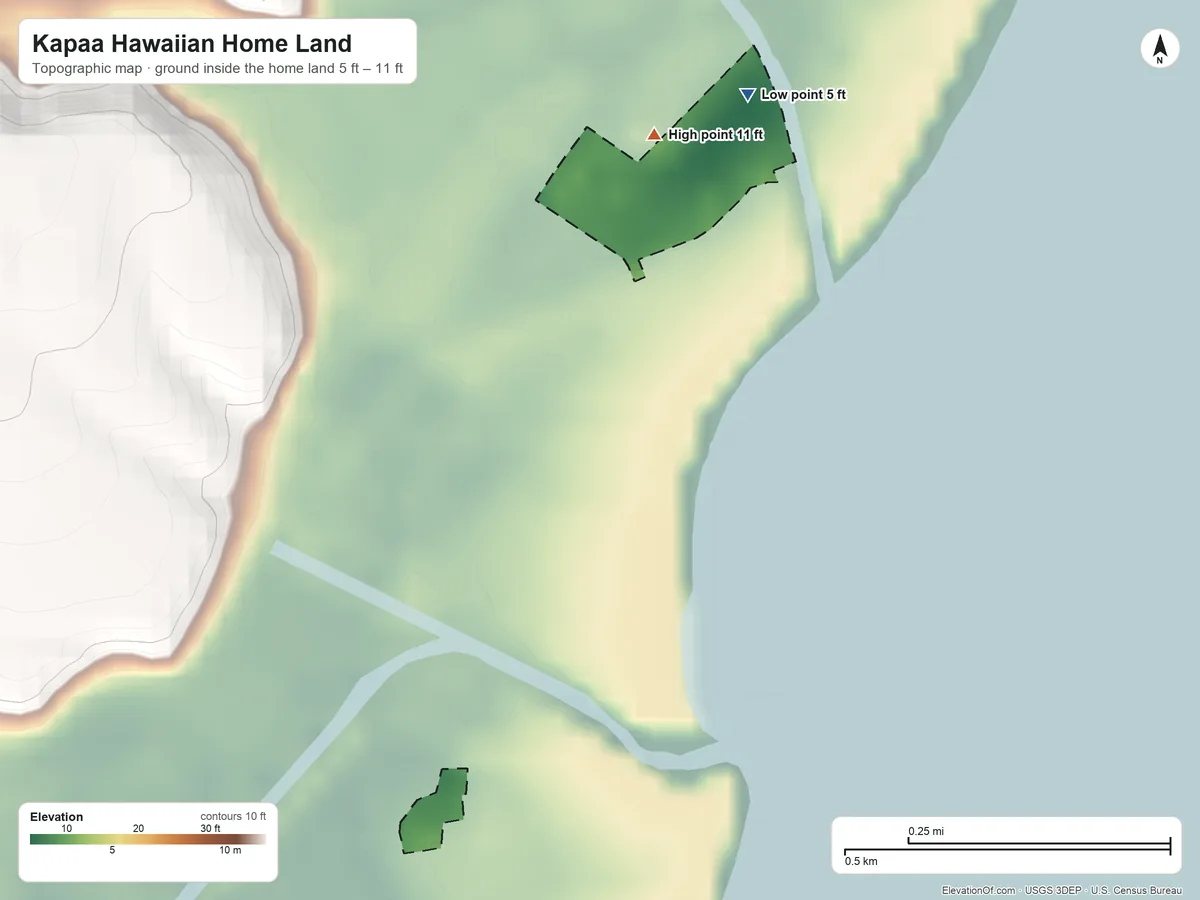
Kapaa Hawaiian Home Land averages about 8 ft (2 m) above sea level across all its land. Its ground runs from 5 ft on the northeast side to 11 ft on the north side.
Average elevation
8 ft 2 m
all land inside the home land
Highest
11 ft 3 m
on the north side
Lowest
5 ft 2 m
on the northeast side
Kapaa Hawaiian Home Land is nearly flat: its ground varies by only about 6 ft, so the figures below sit close together.
| Figure | Elevation |
|---|---|
| Average of all land | 8 ft2 m |
| Highest point Inside the home land, on the north side | 11 ft3 m |
| Lowest point Inside the home land, on the northeast side | 5 ft2 m |
Topographic Map
- Location
- Hawaiian home land in Hawaii, United States (U.S. Census Bureau)
- Land area
- under 0.1 sq mi
- Time zone
- Hawaii-Aleutian UTC−10, no daylight saving
- Drains to
- Pacific Ocean
⤓ Download this map
WebP, 1200 × 900. Free to use: credit “ElevationOf.com” with a link to this page.
Sources: U.S. Census Bureau, USGS
Nearby Places
Nearest tribal lands nearest, by average
- Moloaa Hawaiian Home Land470 ft
- Anahola (Residential) Hawaiian Home Land370 ft
- Anahola (Agricultural) Hawaiian Home Land170 ft
- Hanapepe Hawaiian Home Land120 ft
- Wailua Hawaiian Home Land78 ft
- Kapaa Hawaiian Home Land8 ft
Rankings by average elevation
- Tribal lands in Hawaii73rd highest of 74
- Tribal lands in the United States692nd highest of 704
How we measure
- Average: every USGS 3DEP bare-earth cell of land inside the Census home land boundary (TIGER/Line AIANNH, Jan 1 2026), weighted equally, on a 1 arc-second (≈100 ft, 30 m) grid. Land means the boundary minus Census area water.
- Highest and lowest: the highest land cell. Lowest: the lowest land cell; coastal ground within 3 ft (1 m) of named tidal water counts as sea level.
- Name: the Census Bureau's legal or statistical area name, as published; the nation's own name may differ.
- Population: 2020 Census residents of the blocks inside the boundary.
- Nearby Places: nearest tribal lands and rankings use each one's average elevation, on its own grid, the same figure its page shows. Peaks and hills: the highest summits inside the home land with at least 980 ft (300 m) of prominence, then the highest federal (GNIS) summits inside it when there are fewer than 5; each is the 3DEP top on a ~7 ft (2 m) window, or the NGS published height when a usable survey mark sits within 160 ft (50 m) of it (shown as published).
- Rounding: computed heights are rounded to 10 ft (5 m), or to 1 ft (1 m) under 100 ft; 3DEP is good to about a meter, not a foot. Published figures (NGS survey heights) are shown as their publisher gives them.
- Datum: local mean sea level (Hawaii has no national vertical datum). NGS plans to replace local mean sea level with a new datum (NAPGD2022); heights will then shift slightly.
- Sources: USGS 3DEP, GNIS, Watershed Boundary Dataset and physiographic provinces; U.S. Census Bureau (TIGER boundaries and water, 2020 blocks); NOAA NGS survey heights; BTS time zones. All public domain.