Choctaw OTSA, OK Elevation & Topographic Map
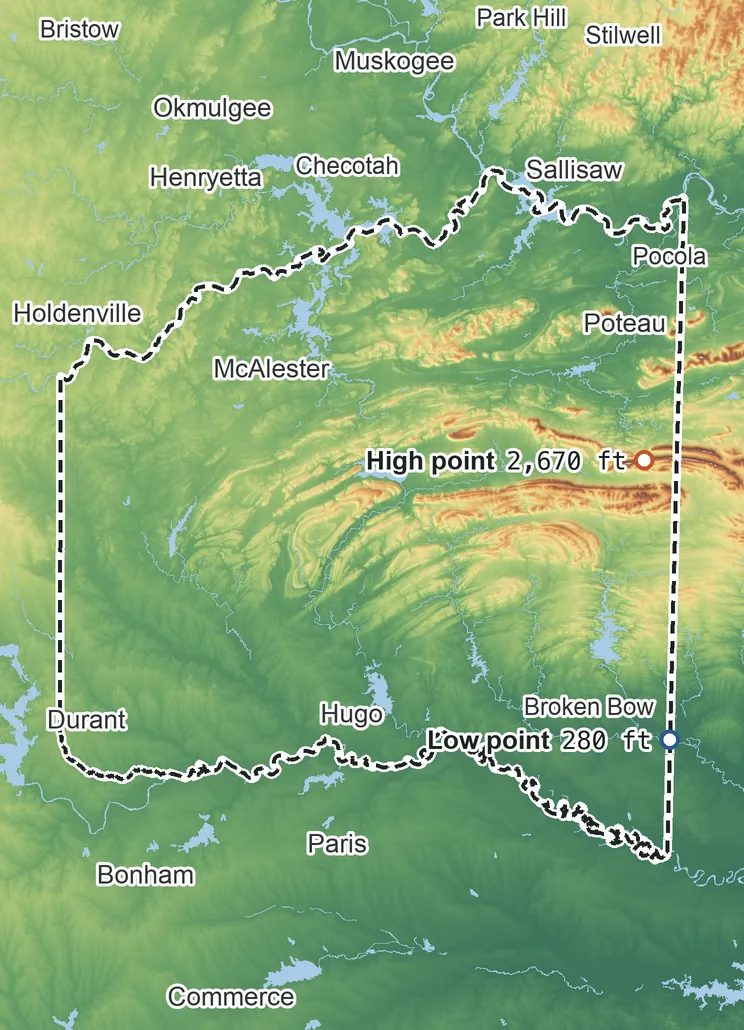
Elevation
2,670 ft 815 m2,070 ft 630 m1,780 ft 540 m1,180 ft 360 m580 ft 175 m280 ft 85 m
Zoom in for contour lines
USGS 3DEP · U.S. Census Bureau
How to use this mapviews, tools and data
- Elevation
- Ground colored by height from green (lowest) to white (highest), with contour lines every 40–500 ft (USGS data).
- Satellite
- A 2016 satellite photo at 33 ft (10 m) detail; contours off.
- 3D
- Tilt and turn the terrain; hills are raised 1.5×, or set ×1 for true height.
- Click or tap anywhere
- The exact elevation of that spot in ft and m.
- Measure
- Pick two points for the climb, descent and grade along a straight line.
- Area
- Fades everything outside the official statistical area boundary (US Census).
Elevation Data
Choctaw OTSA averages about 720 ft (220 m) above sea level across all its land. Its ground runs from 280 ft on the southeast side to 2,670 ft on the east side.
Average elevation
720 ft 220 m
all land inside the statistical area
Highest
2,670 ft 815 m
on the east side
Lowest
280 ft 85 m
on the southeast side
Choctaw OTSA spans about 2,390 ft of height, so no single spot tells the whole story. The ruler shows where most of its land lies, and where the other numbers you'll see come from.
| Figure | Elevation |
|---|---|
| Average of all land | 720 ft220 m |
| Highest point Inside the statistical area, on the east side | 2,670 ft815 m |
| Lowest point Inside the statistical area, on the southeast side | 280 ft85 m |
Elevation profile, west to east
113 mi west to east through Durant.
Topographic Map
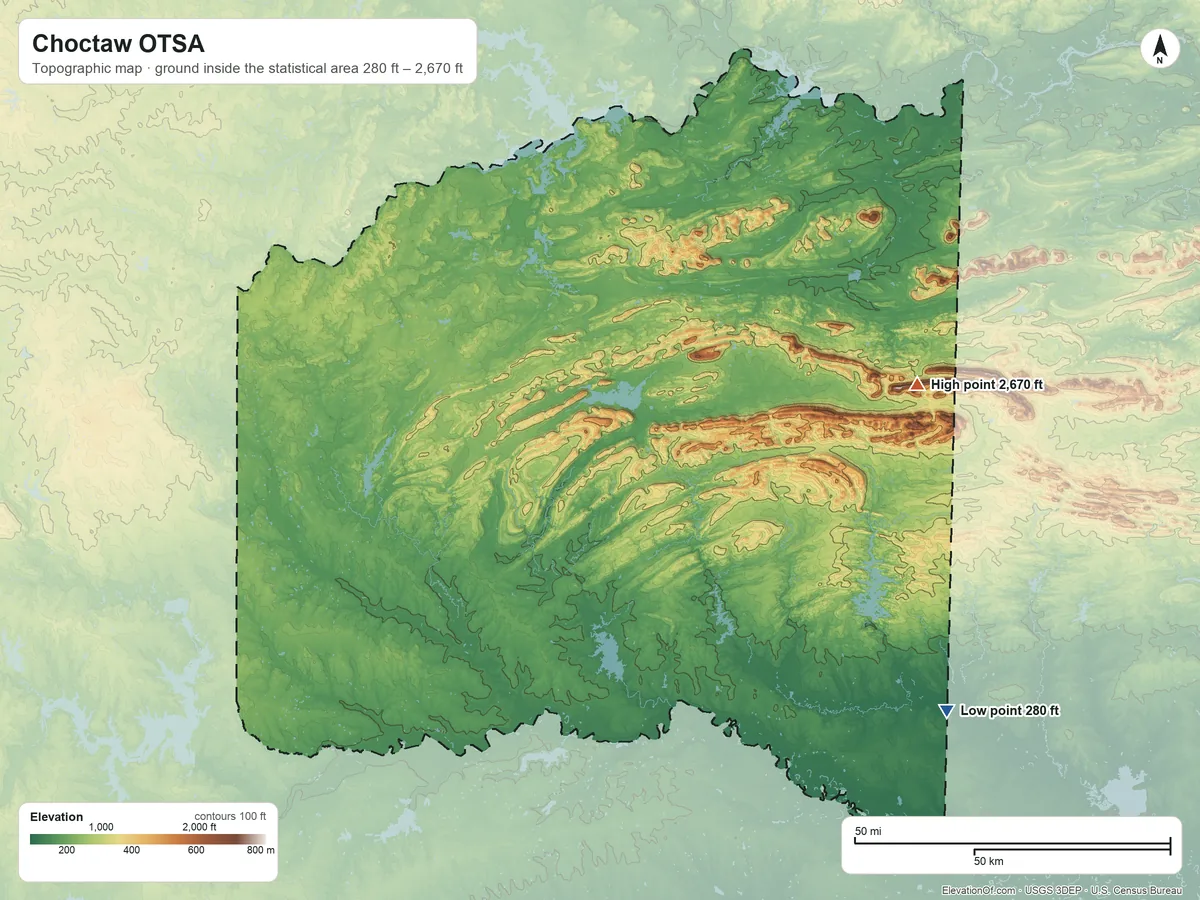
- Location
- Oklahoma tribal statistical area in Oklahoma, United States (U.S. Census Bureau)
- Population
- 226,984 2020 Census
- Land area
- 10,631.3 sq mi + 283.2 sq mi water
- Density
- 21 per sq mi
- Time zone
- Central UTC−6 / −5
- Landform regions
- Ouachita 57%, Coastal Plain 31%, Central Lowland 12%
- Drains to
- Gulf of America
⤓ Download this map
WebP, 1200 × 900. Free to use: credit “ElevationOf.com” with a link to this page.
Sources: U.S. Census Bureau, USGS
Nearby Places
Nearest tribal lands nearest, by average
- Citizen Potawatomi Nation-Absentee Shawnee OTSA1,060 ft
- Chickasaw OTSA970 ft
- Seminole OTSA920 ft
- Creek/Seminole joint-use OTSA880 ft
- Creek OTSA740 ft
- Choctaw OTSA720 ft
Rankings by average elevation
- Tribal lands in Oklahomalowest of 31
- Tribal lands in the United States326th highest of 704
Peaks and hills highest inside
- Quentin Peak2,670 ft
- Sugar Loaf Mountain2,570 ft
- Lynn Mountain2,480 ft
- Cavanal Mountain2,380 ft
- Buffalo Mountain2,140 ft
All 111 towns in the statistical area by typical elevation
- Allen870 ft
- Gerty840 ft
- Atwood790 ft
- Pittsburg770 ft
- Ashland770 ft
- Bache760 ft
- Arpelar760 ft
- Coleman760 ft
- Calvin750 ft
- Kiowa750 ft
- Stuart750 ft
- Carlton Landing740 ft
- Blanco730 ft
- Hochatown730 ft
- Caddo720 ft
- Savanna720 ft
- McAlester720 ft
- Centrahoma710 ft
- Haywood710 ft
- Scipio700 ft
- Whitesboro700 ft
- Gowen700 ft
- Calera700 ft
- Hartshorne700 ft
- Tupelo700 ft
- Talihina690 ft
- Clarita690 ft
- Nashoba690 ft
- Alderson690 ft
- Enterprise690 ft
- Wardville680 ft
- Haileyville680 ft
- Panola680 ft
- Canadian Shores670 ft
- Kenefic670 ft
- Canadian670 ft
- Durant670 ft
- Wilburton660 ft
- Indianola660 ft
- Albion660 ft
- Krebs660 ft
- Longtown660 ft
- Stringtown640 ft
- Bokchito630 ft
- Clayton630 ft
- Quinton630 ft
- Wapanucka630 ft
- Crowder630 ft
- Fanshawe620 ft
- Adamson620 ft
- Tushka620 ft
- Lehigh620 ft
- Bug Tussle620 ft
- Bennington610 ft
- Coalgate610 ft
- McCurtain610 ft
- Boswell600 ft
- Cottonwood600 ft
- Tuskahoma600 ft
- Armstrong590 ft
- Red Oak590 ft
- Phillips590 ft
- Albany590 ft
- Utica590 ft
- Lequire580 ft
- Lane580 ft
- Town of Caney580 ft
- Atoka580 ft
- Heavener570 ft
- Stigler570 ft
- Bentley570 ft
- Blue570 ft
- Hoyt560 ft
- Whitefield560 ft
- Le Flore550 ft
- Hodgen550 ft
- Kinta550 ft
- Soper540 ft
- Hugo530 ft
- Monroe530 ft
- Bokoshe520 ft
- Valliant520 ft
- Antlers520 ft
- Tamaha510 ft
- Arkoma510 ft
- Wister510 ft
- Rock Island500 ft
- Millerton500 ft
- Rattan500 ft
- Poteau500 ft
- Howe500 ft
- Finley490 ft
- Keota490 ft
- Cameron490 ft
- Spiro490 ft
- Garvin480 ft
- Swink480 ft
- Moyers480 ft
- Idabel480 ft
- Shady Point470 ft
- Grant470 ft
- Fort Coffee460 ft
- Broken Bow460 ft
- Panama450 ft
- Pocola450 ft
- Sawyer450 ft
- Fort Towson450 ft
- Wright City410 ft
- Haworth410 ft
- Golden390 ft
- Eagletown390 ft
How we measure
- Average: every USGS 3DEP bare-earth cell of land inside the Census statistical area boundary (TIGER/Line AIANNH, Jan 1 2026), weighted equally, on a 3 arc-second (≈300 ft, 93 m) grid, coarsened from 1 arc-second so the whole area fits one run. Land means the boundary minus Census area water (on this grid, water areas of at least half a cell).
- Highest and lowest: the highest land cell, re-read at 1 arc-second around the 25 highest grid cells. Lowest: the lowest land cell, re-read at 1 arc-second around the 25 lowest grid cells; coastal ground within 3 ft (1 m) of named tidal water counts as sea level.
- Name: the Census Bureau's legal or statistical area name, as published; the nation's own name may differ.
- Population: 2020 Census residents of the blocks inside the boundary.
- Nearby Places: nearest tribal lands and rankings use each one's average elevation, on its own grid, the same figure its page shows. Peaks and hills: the highest summits inside the statistical area with at least 980 ft (300 m) of prominence, then the highest federal (GNIS) summits inside it when there are fewer than 5; each is the 3DEP top on a ~7 ft (2 m) window, or the NGS published height when a usable survey mark sits within 160 ft (50 m) of it (shown as published).
- Towns: each town's typical elevation (population-weighted median of its own 2020 blocks at 1 arc-second); a town is listed when any of its 2020 residents live in the statistical area.
- Rounding: computed heights are rounded to 10 ft (5 m), or to 1 ft (1 m) under 100 ft; 3DEP is good to about a meter, not a foot. Published figures (NGS survey heights) are shown as their publisher gives them.
- Datum: North American Vertical Datum of 1988 (NAVD 88). NGS plans to replace NAVD 88 with a new datum (NAPGD2022); heights will then shift slightly.
- Sources: USGS 3DEP, GNIS, Watershed Boundary Dataset and physiographic provinces; U.S. Census Bureau (TIGER boundaries and water, 2020 blocks); NOAA NGS survey heights; BTS time zones. All public domain.