Cherokee OTSA, OK Elevation & Topographic Map
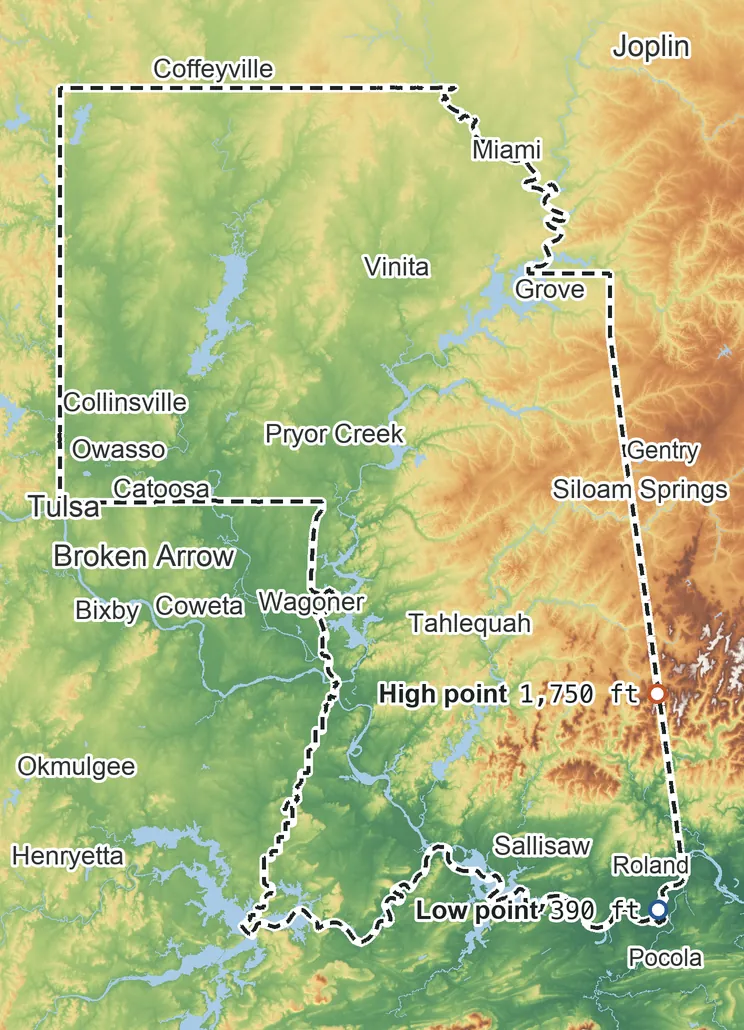
Elevation
1,750 ft 535 m1,410 ft 430 m1,240 ft 380 m900 ft 275 m560 ft 170 m390 ft 120 m
Zoom in for contour lines
USGS 3DEP · U.S. Census Bureau
How to use this mapviews, tools and data
- Elevation
- Ground colored by height from green (lowest) to white (highest), with contour lines every 40–500 ft (USGS data).
- Satellite
- A 2016 satellite photo at 33 ft (10 m) detail; contours off.
- 3D
- Tilt and turn the terrain; hills are raised 1.5×, or set ×1 for true height.
- Click or tap anywhere
- The exact elevation of that spot in ft and m.
- Measure
- Pick two points for the climb, descent and grade along a straight line.
- Area
- Fades everything outside the official statistical area boundary (US Census).
Elevation Data
Cherokee OTSA averages about 790 ft (240 m) above sea level across all its land. Its ground runs from 390 ft on the southeast side to 1,750 ft on the southeast side.
Average elevation
790 ft 240 m
all land inside the statistical area
Highest
1,750 ft 535 m
on the southeast side
Lowest
390 ft 120 m
on the southeast side
Cherokee OTSA spans about 1,360 ft of height, so no single spot tells the whole story. The ruler shows where most of its land lies, and where the other numbers you'll see come from.
| Figure | Elevation |
|---|---|
| Average of all land | 790 ft240 m |
| Highest point Inside the statistical area, on the southeast side | 1,750 ft535 m |
| Lowest point Inside the statistical area, on the southeast side | 390 ft120 m |
Elevation profile, west to east
79 mi west to east through Owasso.
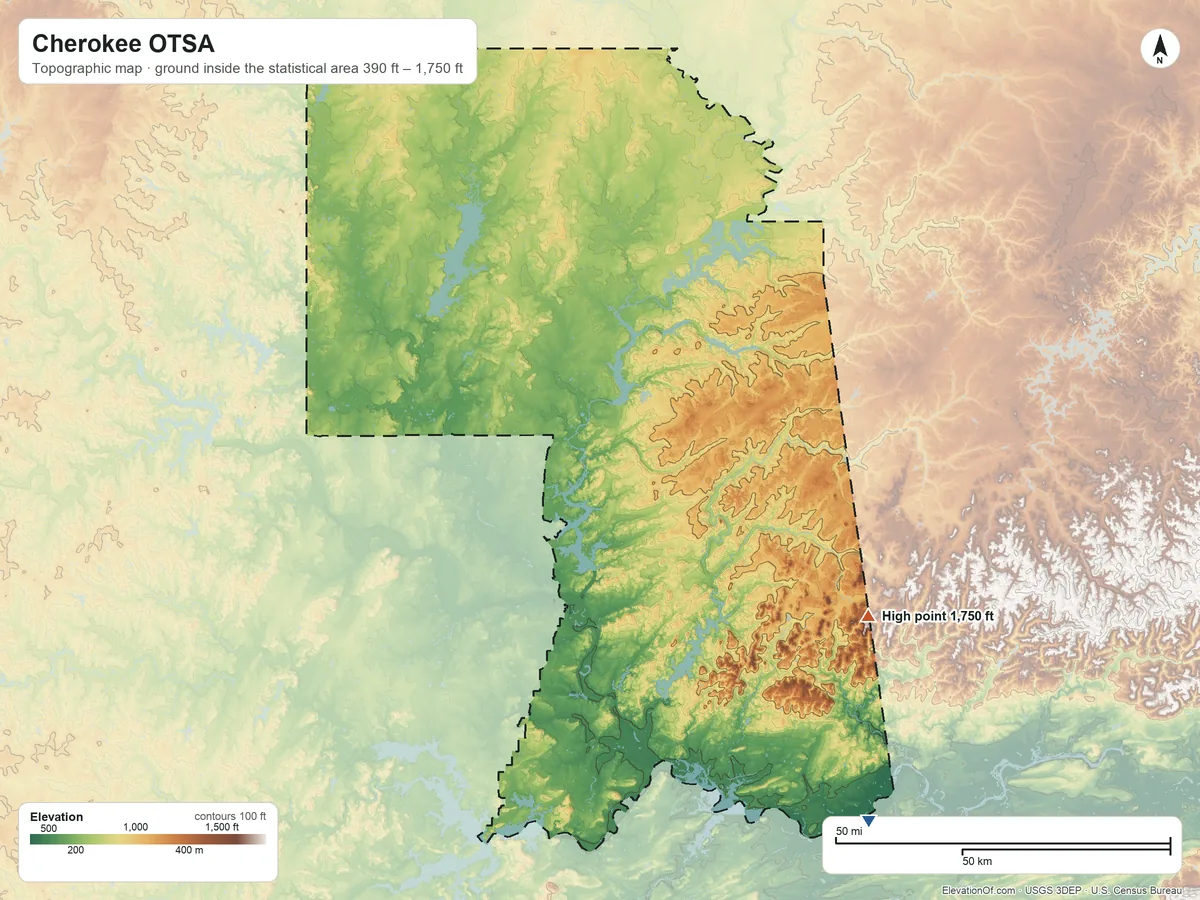
Topographic Map
- Location
- Oklahoma tribal statistical area in Oklahoma, United States (U.S. Census Bureau)
- Population
- 513,178 2020 Census
- Land area
- 6,694.0 sq mi + 269.3 sq mi water
- Density
- 77 per sq mi
- Time zone
- Central UTC−6 / −5
- Landform regions
- Central Lowland 48%, Ozark Plateaus 33%, Ouachita 19%
- Drains to
- Gulf of America
⤓ Download this map
WebP, 1200 × 900. Free to use: credit “ElevationOf.com” with a link to this page.
Sources: U.S. Census Bureau, USGS
Nearby Places
Nearest tribal lands nearest, by average
- Seneca-Cayuga OTSA900 ft
- Eastern Shawnee OTSA870 ft
- Wyandotte OTSA850 ft
- Ottawa OTSA810 ft
- Cherokee OTSA790 ft
- Miami/Peoria joint-use OTSA780 ft
Rankings by average elevation
- Tribal lands in Oklahoma28th highest of 31
- Tribal lands in the United States297th highest of 704
Peaks and hills highest inside
- Workman Mountain1,740 ft
- Doublehead Mountain1,630 ft
- Muskrat Mountain1,620 ft
- Killer Mountain1,620 ft
- Beaver Mountain, Cherokee County1,620 ft
All 211 towns in the statistical area by typical elevation
- Elohim City1,270 ft
- Chance1,170 ft
- Kansas1,150 ft
- Colcord1,150 ft
- Fairfield1,150 ft
- Cloud Creek1,140 ft
- Greasy1,130 ft
- Westville1,130 ft
- West Siloam Springs1,130 ft
- Leach1,130 ft
- Twin Oaks1,120 ft
- Lowrey1,120 ft
- Indianola, Delaware County1,120 ft
- Stoney Point1,110 ft
- Piney1,110 ft
- Honey Hill1,110 ft
- Old Green1,100 ft
- Stilwell1,100 ft
- Marietta, Adair County1,100 ft
- Sycamore1,100 ft
- Evening Shade1,090 ft
- Peavine1,080 ft
- Titanic1,080 ft
- Dripping Springs1,080 ft
- Lyons Switch1,070 ft
- Christie1,070 ft
- Deer Lick1,070 ft
- Oaks1,070 ft
- Zion1,070 ft
- Cherry Tree1,070 ft
- Johnson Prairie1,070 ft
- Flint Creek1,060 ft
- Mulberry1,060 ft
- New Eucha1,060 ft
- Steely Hollow1,060 ft
- Elm Grove1,060 ft
- Rocky Mountain1,040 ft
- Jay1,040 ft
- West Peavine1,030 ft
- Chewey1,020 ft
- Rocky Ford1,020 ft
- White Water1,010 ft
- Moodys1,010 ft
- Cave Spring1,000 ft
- Watts1,000 ft
- Baron1,000 ft
- Bull Hollow990 ft
- Grandview980 ft
- Wauhillau980 ft
- Oak Hill-Piney970 ft
- Rose960 ft
- Pumpkin Hollow960 ft
- Teresita960 ft
- Caney950 ft
- Brush Creek940 ft
- Zena940 ft
- Peggs940 ft
- Cedar Crest930 ft
- Old Eucha930 ft
- Eldon930 ft
- Dodge930 ft
- Tagg Flats920 ft
- Bell920 ft
- Snake Creek920 ft
- Box910 ft
- Little Rock910 ft
- Blackgum910 ft
- Kenwood900 ft
- Barber900 ft
- Briggs890 ft
- Brushy890 ft
- Drowning Creek890 ft
- Gideon880 ft
- Keys870 ft
- Long870 ft
- Sparrowhawk860 ft
- Wann860 ft
- Proctor860 ft
- Dennis850 ft
- Tenkiller850 ft
- Butler, Delaware County850 ft
- Wickliffe840 ft
- Lost City830 ft
- Tahlequah830 ft
- Fairland830 ft
- Welch830 ft
- Welling820 ft
- Narcissa820 ft
- Liberty820 ft
- Pettit820 ft
- Cayuga partly820 ft
- Disney810 ft
- Remy810 ft
- Bunch800 ft
- Dry Creek800 ft
- Belfonte800 ft
- White Oak800 ft
- Zeb800 ft
- Park Hill790 ft
- Cookson790 ft
- Afton790 ft
- Miami partly790 ft
- Pump Back790 ft
- Grove790 ft
- Grand Lake Towne790 ft
- Dotyville790 ft
- Paradise Hill790 ft
- Bernice780 ft
- Ketchum770 ft
- Cleora770 ft
- Bluejacket770 ft
- Langley770 ft
- Iron Post770 ft
- Flute Springs770 ft
- Copan770 ft
- Shady Grove770 ft
- Etta770 ft
- Bushyhead760 ft
- Woodall760 ft
- Copeland760 ft
- Lenapah750 ft
- Nicut750 ft
- Redbird Smith750 ft
- Ochelata750 ft
- New Alluwe740 ft
- Watova730 ft
- Foyil730 ft
- Dwight Mission720 ft
- South Coffeyville720 ft
- Bartlesville720 ft
- Sour John720 ft
- Ballou720 ft
- Big Cabin720 ft
- Pinhook Corner720 ft
- Murphy720 ft
- Chelsea720 ft
- Delaware720 ft
- Short720 ft
- Nowata710 ft
- Tulsa partly700 ft
- Vinita700 ft
- Caney Ridge700 ft
- Sequoyah700 ft
- Limestone700 ft
- Dewey700 ft
- Norwood700 ft
- Locust Grove690 ft
- Talala690 ft
- Sportmans Shores690 ft
- Spavinaw680 ft
- Adair680 ft
- Shady Grove, McIntosh County680 ft
- Simms680 ft
- Skiatook partly660 ft
- Ramona660 ft
- Valley Park660 ft
- Pensacola660 ft
- Owasso660 ft
- Vera660 ft
- Collinsville650 ft
- Strang650 ft
- Marble City650 ft
- Pin Oak Acres650 ft
- Salina650 ft
- Catoosa650 ft
- Gregory640 ft
- Hulbert640 ft
- Tiawah640 ft
- Justice640 ft
- Duchess Landing640 ft
- Oologah630 ft
- Texanna partly630 ft
- Claremore630 ft
- Carlisle630 ft
- Pryor Creek630 ft
- Chouteau630 ft
- Sperry620 ft
- Whitehorn Cove620 ft
- Taylor Ferry620 ft
- Turley620 ft
- Sams Corner620 ft
- Fair Oaks partly620 ft
- Akins620 ft
- Sportsmen Acres610 ft
- Rocky Point610 ft
- Mazie610 ft
- Verdigris610 ft
- Inola partly600 ft
- Porum590 ft
- Muskogee partly580 ft
- Hanson580 ft
- Sand Hill580 ft
- Mallard Bay580 ft
- Warner580 ft
- Badger Lee580 ft
- Braggs560 ft
- Briartown560 ft
- Fort Gibson550 ft
- Vian550 ft
- Keefton540 ft
- Okay540 ft
- Notchietown540 ft
- Sallisaw530 ft
- River Bottom530 ft
- Gans530 ft
- Gore510 ft
- Brent510 ft
- Muldrow510 ft
- Webbers Falls480 ft
- Roland470 ft
- Moffett410 ft
How we measure
- Average: every USGS 3DEP bare-earth cell of land inside the Census statistical area boundary (TIGER/Line AIANNH, Jan 1 2026), weighted equally, on a 3 arc-second (≈300 ft, 93 m) grid, coarsened from 1 arc-second so the whole area fits one run. Land means the boundary minus Census area water (on this grid, water areas of at least half a cell).
- Highest and lowest: the highest land cell, re-read at 1 arc-second around the 25 highest grid cells. Lowest: the lowest land cell, re-read at 1 arc-second around the 25 lowest grid cells; coastal ground within 3 ft (1 m) of named tidal water counts as sea level.
- Name: the Census Bureau's legal or statistical area name, as published; the nation's own name may differ.
- Population: 2020 Census residents of the blocks inside the boundary.
- Nearby Places: nearest tribal lands and rankings use each one's average elevation, on its own grid, the same figure its page shows. Peaks and hills: the highest summits inside the statistical area with at least 980 ft (300 m) of prominence, then the highest federal (GNIS) summits inside it when there are fewer than 5; each is the 3DEP top on a ~7 ft (2 m) window, or the NGS published height when a usable survey mark sits within 160 ft (50 m) of it (shown as published).
- Towns: each town's typical elevation (population-weighted median of its own 2020 blocks at 1 arc-second); a town is listed when any of its 2020 residents live in the statistical area.
- Rounding: computed heights are rounded to 10 ft (5 m), or to 1 ft (1 m) under 100 ft; 3DEP is good to about a meter, not a foot. Published figures (NGS survey heights) are shown as their publisher gives them.
- Datum: North American Vertical Datum of 1988 (NAVD 88). NGS plans to replace NAVD 88 with a new datum (NAPGD2022); heights will then shift slightly.
- Sources: USGS 3DEP, GNIS, Watershed Boundary Dataset and physiographic provinces; U.S. Census Bureau (TIGER boundaries and water, 2020 blocks); NOAA NGS survey heights; BTS time zones. All public domain.